
|
Yes, we agree - energy storage is confusing. There are over 70 new battery chemistries being tested or manufactured today. And batteries are just a subset of energy storage more broadly; remember flywheels, pumped hydro, and compressed air? Consider the fun graph about technology maturity on the following page to be further confused. However, if you are providing financing, guarantees, or warranties for energy storage systems, note that the market has validated just one battery technology: Lithium-ion. This chemistry made up 96% of all 2015 energy storage installations by capacity. This is not to say, however, that your energy storage investment strategy over the long term is without risk. Consider three supply chain risks regarding lithium. These may cause a shift to other battery technologies, such as flow batteries: Source: Depending on the year, very little lithium is harvested in the U.S. Moreover, production is controlled largely by just 3 - 4 major companies, which some refer to as an oligarchical structure. Energy Storage Technology by Maturity 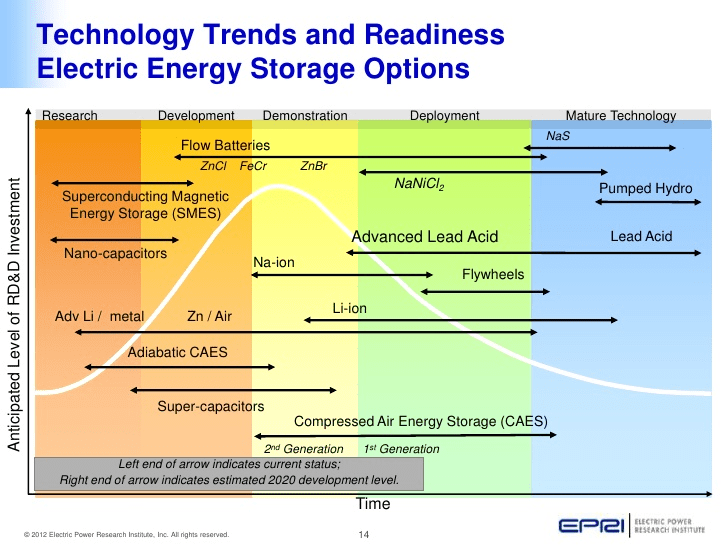 (Source: EPRI) Demand: Global demand for lithium is expected to grow 2x by 2025; as one example, Goldman Sachs suggests that new Tesla Gigafactory alone could consume 17% of current supply. Consider the graph on the following page showing the link between electric vehicle market growth and falling battery costs, which make up ⅓ of car costs. Supply: There is no shortage of lithium reserves. According to the USGS, even if the world increased lithium production 3x from today’s levels, we would still have 135 years of supply. However, what we care about is not reserves but instead the amount of lithium that can be brought to market in time to match the rapidly growing demand from energy storage for grid management, peak shaving, smartphones, laptops, and the many other uses for this precious mineral. And experts suggest that supply will stay below demand for years to come. Lithium Production by Country 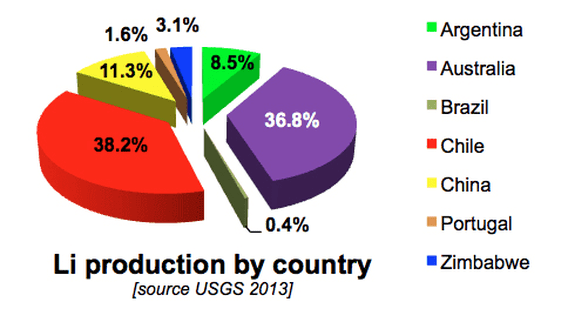 Source: U.S. Geological Survey Falling Lithium-ion Battery Packs (left) vs. Annual Demand for EV Battery Power (right) 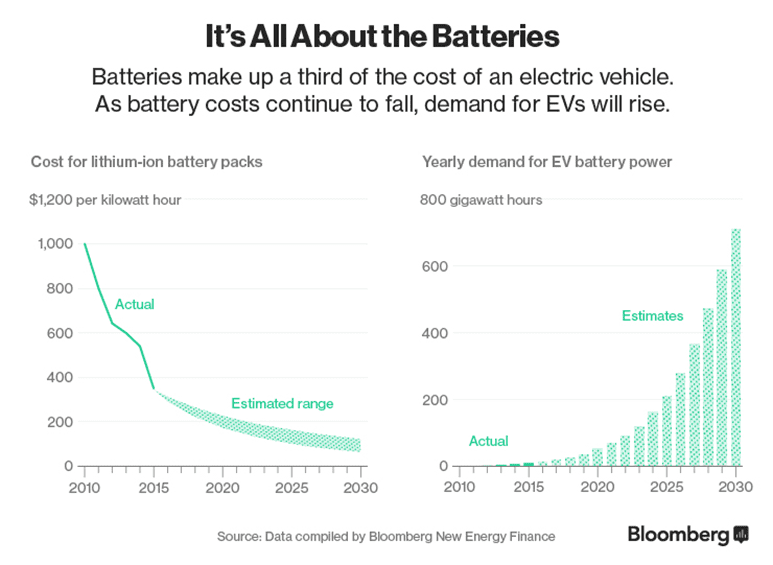 Energy storage investment opportunities are vast, but they are not all the same First, let’s take a look at the big picture: Consider GTM’s U.S. energy storage highlights from 2014 and 2015 (on the next page). Here are five things that stand out:
Energy Storage Scorecard 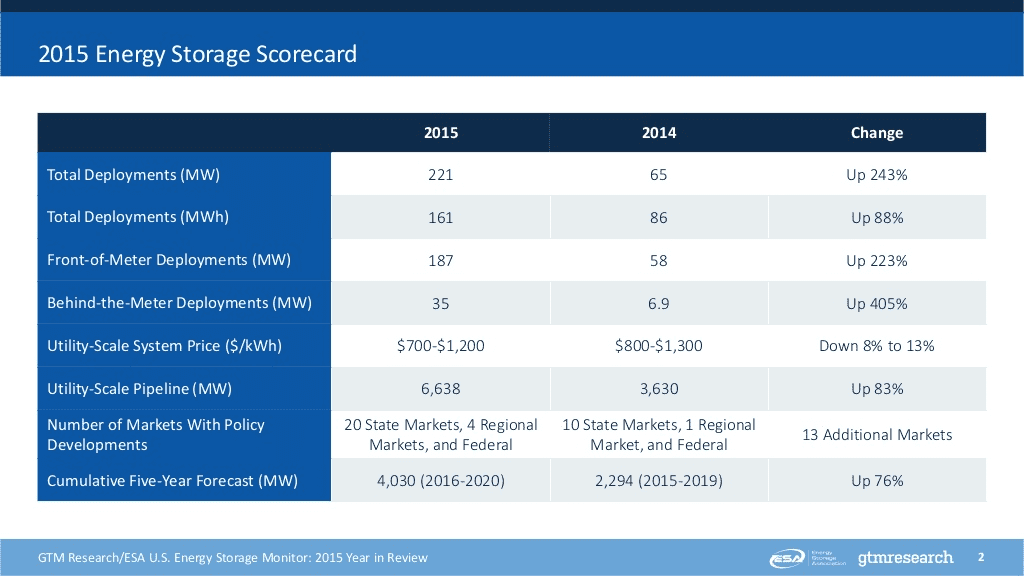 (Source: GTM) As another source of variation in this market growth, consider the graphs below and on the next page. While utility-focused systems dominate today, by 2020 the split becomes more comparable among utility, commercial, community, and residential applications of energy storage. Energy Storage Investment by Sector: 2012 to 2020 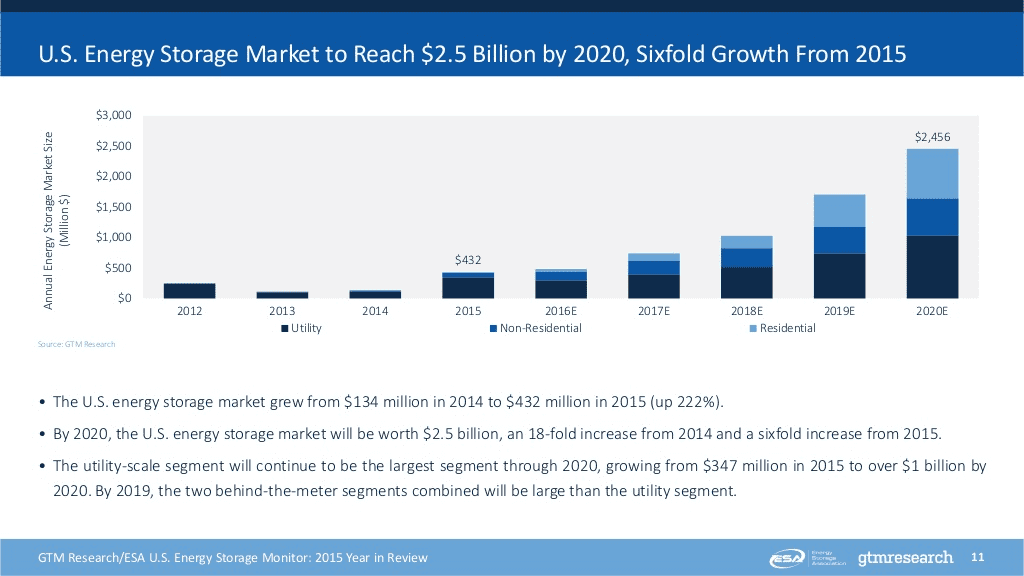 (Source: GTM) Energy Storage Investment by Sector: 2014 to 2024 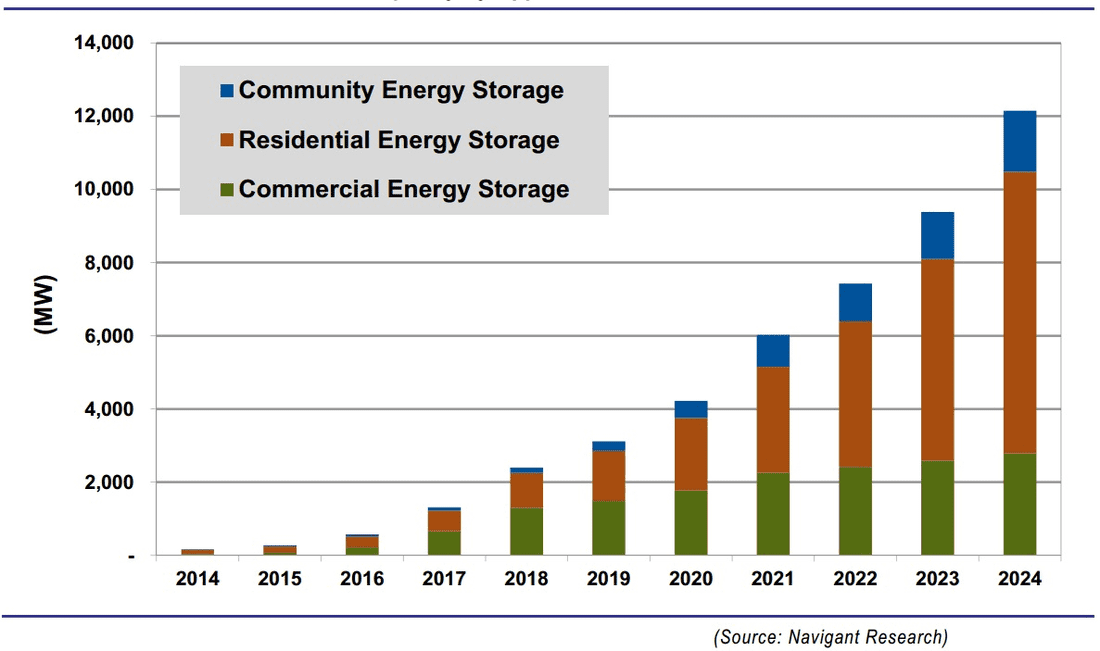 (Source: Navigant) Lastly, consider how energy storage investment opportunities vary based on the type of service provided at the utility level (graph below). The type of service most needed will also vary by state and utility, and drivers will be tied to policy, unregulated versus regulated market structures, degree of deferred grid investment, and a host of other factors. Navigant projects that revenue from this sub-market will exceed $15B by 2024. Energy Storage Capacity by Grid Service: 2014 to 2024 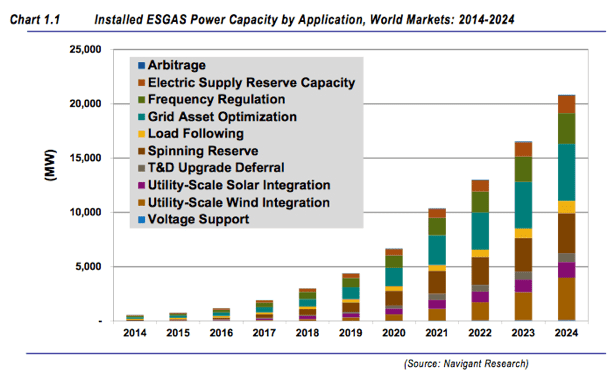 (Source: Navigant)
Comments are closed.
|
sign up for ironoak's NewsletterSent about twice per month, these 3-minute digests include bullets on:
Renewable energy | Cleantech & mobility | Finance & entrepreneurship | Attempts at humor (what?) author
Photo by Patrick Fore on Unsplash
|

© 2009-2022 IronOak Energy Capital, LLC | (888) 249-3013