
|
Until recently, it has seemed that “cleantech VC” was a four-letter word.
Or perhaps a term reserved for hushed whisphers of digust and distrust thanks to the financial woes in the sector about ten years ago. But, it appears that the tide may be turning. Here are three headlines that might give cleantech entrepreneurs some hope. #1: Renewal Funds just raised $145M to invest in cleantech (what?) Here are some highlights (link):
#2: ArcTern Ventures just raised $165M to invest in cleantech (oh my!) Here are some highlights (link):
#3: Clean Energy Ventures just raised $110M to invest in cleantech (gasp!) Here are some highlights (link):
But wait… Before all of us entrepreneurs get too excited about sending an email to these groups and receiving $10M in growth capital the next day, let’s remember this... Venture capital firms reject at least 95%+ of all the deals they review
Far less than 1% of startups raise capital from VC firms. The estimates vary:
In contrast, the last study above showed that “57% of startups are funded by personal loans and credit, while 38% eceive funding from family and friends.” These VC firms like low company valuations.
Fundraising takes a ton of time, and will distract you from running your business.
11/5/2019 Outcompeting lithium-ion in the 2020’s — Which new energy storage technologies might win?Read Now
 By: Dr. Chris Wedding If you think the “energy transition” is just for Democrats or greenies, then consider this quote from a Goldman Sachs natural resource executive: “I’ve probably spent more time talking with oil company executives about the energy shift and renewables in the last 2 years than the previous 23 put together.” Last year, $6.4B was invested in hydrocarbons versus $5.8B in renewable energy, according to PitchBook. That’s a pretty tight race. And a CDP report notes that 2018 expenditure on clean energy sector by the world’s 24 largest oil and gas companies was roughly 1.3% of total budgets vs. 0.7% last year. On one hand, that’s almost 200% growth year-over-year. Or (slight reframe) its chump change as a fraction of overall investments, with 98.7% of capital still going to conventional energy lines of business. Plus, over 70% of those investments came from EU-based oil and gas majors. Maybe that’s because the science of climate change is magically different across the ocean. (Yep, sarcasm) As further evidence that times are changing, here’s a look at three organizations…
Why are oil and gas major making these investments now? #1. They are already experts in the energy sector. This is partly a situation of a [very powerful] hammer seeking a nail. Decades of experience in conventional energy can translate into efficient capital deployment, project development, and new technology commercialization in the new energy sector, too. Building and operating offshore oil rigs is complicated. The same is true for offshore wind projects, and this is a market expected to reach $60B by 2024. “Have skills, should apply.” Running gas stations is not rocket science, but profitability is also not a given. So, it makes sense for Chevron to add EV charging to its gas stations, as long as they get the rate tariffs right so they do not drown in pricey demand charges. #2. Clean energy investments can be a hedge against softer demand for oil and gas. When Fitch Ratings talks about the growth in electric vehicles potentially creating an “investor death spiral,” it’s worth listening to their reasons. #3. Renewable energy markets are not little runts to ignore anymore. Bloomberg projects that over 70% of all new power capacity investment between now and 2050 is expected to be in solar and wind projects. Their research further shows that clean energy sector investment has exceeded $300B globally for the last five years. Finally, analysis suggests that the advanced energy economy (clean power, alternative transportation, energy-efficient buildings) now exceeds $1.4T, or twice the size of the global airline industry. #4. Corporate sustainability reporting is becoming mainstream. “We are watching you.” At least 85% of Fortune 500 companies now engage in sustainability reporting. Drivers of this trend include stakeholder demands, global trends towards greater transparency, peer pressure, and a realization that sustainability topics can be material to financial risk and return. Samples of third-party sustainability reporting include the following:
What kinds of new energy investments are oil and gas majors making in the last two years? I will only focus on the top four oil and gas majors in terms of their investments in and commitments to lower carbon energy. This includes Total, BP, Equinor, and Shell. (See graph below). 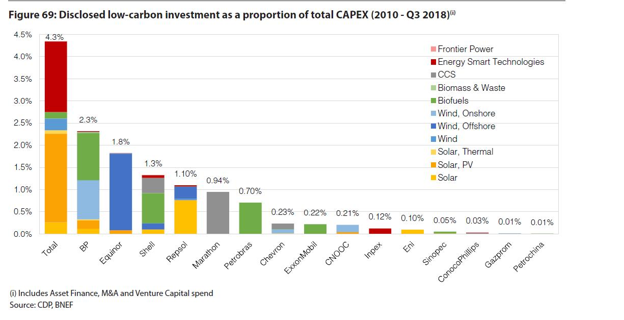 I am mostly listing investments by their VC arms, with some other infrastructure investments sprinkled in here and there. Finally, I am not listing companies that are “kind of” related to clean energy, such as ride sharing or financial settlement technologies for the energy sector. Total Energy Ventures
BP Ventures (plus some larger corporate deals)
Equinor Technology Ventures
Shell Ventures (and some bigger Shell New Energies deals)
How will investing in renewable energy be different than their historic energy investments? If recent history is a good predictor (not always true), then low carbon investments are likely to be different than conventional energy investments in the following ways:
How does the increasing involvement of oil and gas majors create winners or losers in the clean energy sector? The (potential) winners include:
The (potential) losers include:
Should you be bearish or bullish? Bearish perspective: Why these trends can be easily ignored
Bullish perspective: Why investors and entrepreneurs should pay more attention
In conclusion, here are some potential action items I will describe these as the 3 “C’’s, with questions for you to ask yourself, answer, and do something about over the next 30 days. (Or just hide under them rug for a while. What could possibly go wrong?) #1 - Canary What do these trends mean in terms of “canaries in the coal mine” for your overall investments in the conventional power, oil, and gas sectors? (Pun intended.) If a Shell executive refers to their “buying spree” in the low carbon sector like this -- “It’s all about survival” — then how or why would your investment allocation to the conventional energy sector be different, and therefore, not face some new risks? If McKinsey and Mining.com report that electric vehicles will likely reach cost parity with conventional vehicles in the early 2020’s, and if Fitch Ratings talks about how this shift in transportation choices could cause an “investor death spiral,” how might you view current or future investments in the oil sector? #2 - Clock Even if you agree that historic changes are coming to energy markets, the key question is this: When? When do you (or sources you trust) think that these shifts in energy investments will actually affect your portfolio? By way of analogy, at some point we may live on Mars, but now is likely not the right time to invest in Martian real estate. (Unless you’re a billionaire who thinks that all hope is lost for long-term survival on this planet.) #3 - Collaboration There may be winners and losers, but it is not a zero sum game. This discussion needs a reframe. Let’s consider a newly created 21st century word: “Coopetition” — collaboration between competitors for mutually beneficial results. For environmentally minded entrepreneurs, how can oil and gas majors be strategic partners, investors, and customers, instead of the enemy, a monolithic group to badmouth for all the world’s problems, the 800-pound gorilla that must be defeated. For VC or private equity investors, how can oil and gas major’s investment decisions serve as an anchors to derisk your capital allocation alongside them? How can you build relationships with them for a future exit opportunities? Finally, thank you... A big shout out to Pitchbook, IPE Real Assets, Greenbiz, Preqin, Bloomberg New Energy Finance, Advanced Energy Economy, Greentech Media, Reuters, CDP, RW Baird, Energy Storage News, Columbia University’s Earth Institute, Oilprice.com, Bloomberg, Mining.com, McKinsey & Company, ThinkProgress, Wind Power Engineering, and Governance & Accountability Institute for their research and reporting on this topic.  By: Chris Wedding, PhD “You miss 100% of the shots you don’t take.” Depending on whether you are from the South or the North, you’ll think that quote was attributed to Michael Jordan or Wayne Gretzky. With two degrees and a professorship at UNC Chapel Hill, I’m definitely going with MJ. Regardless, this pithy wisdom applies to our topic at hand — Innovators that harnessed blood, sweat, tears, and billions of dollars to shoot for the moon with bold battery solutions that did not work out. The silver lining (or maybe it’s lithium) is that those were the early days. And it’s better to gamble with pennies than with gold. Going forward through 2040, Bloomberg projects $620B to be invested in the battery sector. That’s a frighteningly large amount of capital. So we better learn lessons from those early failures and invest these dollars intelligently. First, a review of why batteries are wonderful... Below are three figures which tell a compelling story. #1 The 13 benefits that batteries can create for building owners (behind the meter), utilities (front of the meter), and grid operators (e.g., Independent System Operators). — Source: RMI 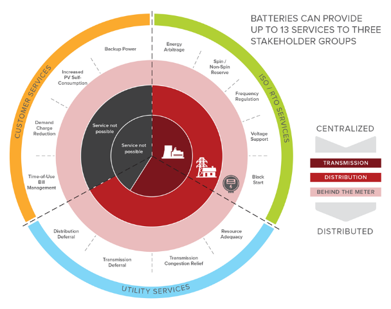 #2 The surprising growth of residential energy storage installation in the U.S. — Source: GTM Research / ESA U.S Energy Storage Monitor 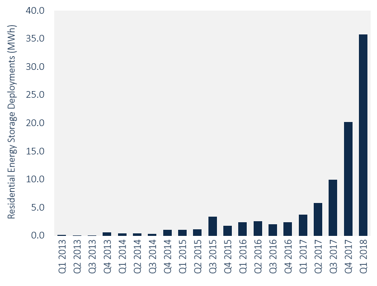 #3 Areas of the U.S. where commercial and industrial energy storage can produce an attractive return on investment today, not in some distant future where Elon Musk is the next billionaire president. — Source: NREL 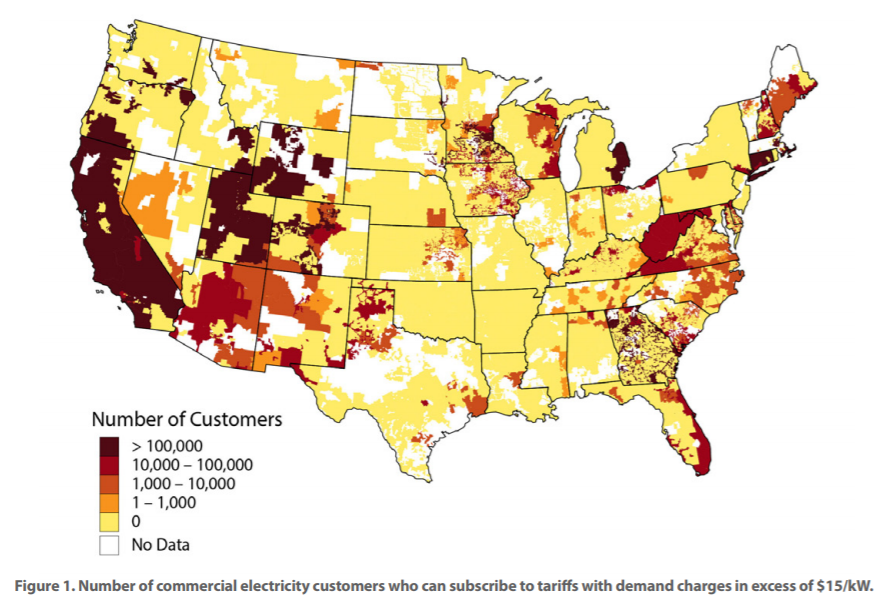 And now, a list of battery companies “with arrows in their backs” The following companies were cutting edge, but the cuts went too deep. God bless them for being innovators that were too early. A123 Systems
Alevo
Aquion Energy
Better Place
Fisker
In aggregate, these companies raised more than $5B from smart, accomplished, and connected investors, such as the following:
Sources: Pitchbook, Crunchbase, Greentech Media, PV Magazine, VentureBeat, and the New Yorker Finally, 10 lessons for “keeping your shoes clean in a cow field” #1 Focus. Focus. Focus. — Some battery manufacturers tried to serve multiple markets and geographies, across both stationary (power grid) and EV (electric vehicle) sectors. You have to pick. Say no. You’ve heard it before: “If you try to please everyone, you’ll end up pleasing no one.” #2 Vet storage technologies the way that investors vet energy project investments — This matters because ultimately tech needs to scale into deployments. Below are six questions to ask of a battery technology and company:
#3 Apply the pre-mortem — Watch for “froth.” If all investors are in love with the company, ask why it could fail. Once you identify the flaws, ask whether there are risk mitigation strategies, and if you believe them. Ignorance is not bliss. #4 Manage burn-rate like a hawk — Raising a big round, or being on a rocket ship based on confident financial projections are not excuses to spend too much. Pretend your dad was a CPA like mine. Make sure a board is in place and that they firmly hold the executive team accountable, without applying a death grip. #5 Compete against the giants with your eyes wide open — If the battery technology company wants to oust lithium-ion batteries from their global dominance, then get ready for a long, uphill battle. Granted, at the top of that hill, you might see a pot of gold waiting. But you may have aged a decade in the process. Or maybe instead you should just climb a different hill: Find a niche use case where lithium-ion is not the answer. Find its weakest performance parameter, innovate to excel on that same attribute, and then find the one customer segment in a specific geography that loses sleep over that problem you could solve with a non-lithium-ion solution. #6 Don’t depend on business-to-customer sale channels — As individuals, we are fickle, distracted buyers. Businesses are not. They seek what’s best for them and buy in large quantities. Find battery companies that make businesses happy. Then sell to them in order to reach your ultimate customer, whether it is the business or that business’ customers. For example, make the utility or auto manufacturer your friend, not your foe. #7 Partner with strategic investors — These guys (and gals) provide three benefits: (1) They might be more patient with their capital, allowing time to maximize company value before exiting an investment. (2) They can provide fantastic validation that the storage company has market potential and may indeed scratch their own itch. (3) They can be extraordinary customers that “make the business,” adding serious revenue through large contracts. #8 Raise capital before you need it — Plenty of companies run out of cash before they raise their next round. This was also true for some early stage storage startups. Don’t depend on cash flows for growth too early on in the business. Raise more than you think you need, share the pie, and earn the opportunity to watch it grow. #9 Prioritize capital-light business models — If the battery company wants to use lots of venture capital to build factories, run away. Far away. Instead, contract manufacturing, creative lines of credit, and supportive supply chain partners can reduce capital cost needs. In addition, it always helps to invest in the “brains” of the storage devices. Get some intellectual property, some software, and some automation. #10 Good looks alone won’t cut it — Cool design can’t overcome poor quality or inconvenience. That said, ugly form factors can also be recipe for inducing yawns if there is any consumer component to the sales cycle. Find the balance. But keep your eye on the target: High performance. In conclusion… I’ll conclude with a relevant metaphor that takes me back to my days in Kentucky... We’re off to the races. Don’t be too late to make that bet. Pick your jockey(s). Pick your horse(s). The prize money is much more than a bucket of oats.  The energy storage market is kind of like the Loch Ness Monster — It’s rarely seen. It’s said to be huge. And many think it’s not real. If you’re like us, you have dozens of articles and reports on energy storage (and other topics) starred for reading later. But “later” never seems to arrive with the free time you needed to read about this high potential market. As such, we’re providing this “Cheat Sheet for Energy Storage Finance” based on our work as buy-side and sell-side investment bankers experienced in both energy storage venture capital and project finance. I’m also including some perspectives from my panel last week at the UNC Cleantech Summit entitled “Financing Energy Storage.” Thanks to Greentech Media, GTM Research, Utility Dive, Bloomberg New Energy Finance, Bloomberg, McKinsey & Company, i3 (Cleantech.com), Lazard, Energy Storage Association, PV Magazine, Rocky Mountain Institute, Renewable Energy World, and Energy Storage News for their great work that helped us compile this research. The Market Opportunity Big picture: The rise of energy storage is expected to mirror the giant leap that the solar sector took between 2000 and 2015 (link). For those of you who rode the solar roller coaster like we did, you might want to get that amusement park seatbelt and whiskey ready. You may need them. Global Market 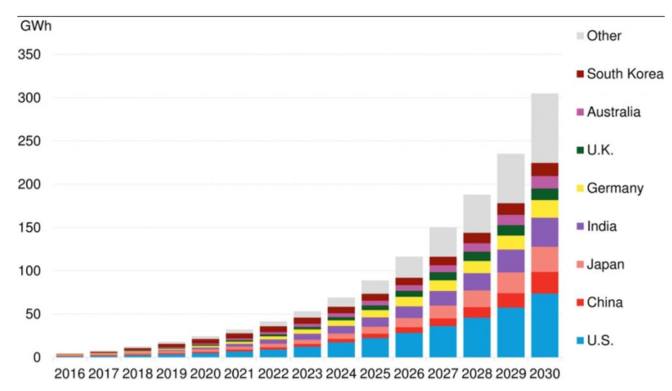 U.S. Market
This September 2018 headline from Bloomberg sums it up well on the residential front: “Residential Energy Storage Surging, No Longer Just a ‘Cool Toy’” (link) Their impetus was two-fold:
  U.S. Annual Energy Storage Deployment Forecast: 2012-2022E (millions of dollars) Source: Greentech Media 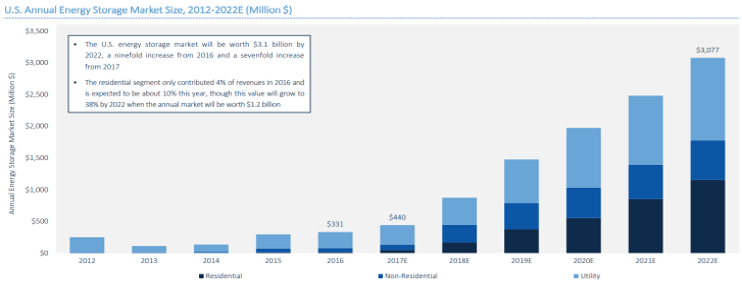  Technology
Angel & Venture Capital Finance We’re just in the first inning of this game. And for a guy who prefers basketball (born in Kentucky and living in North Carolina), that’s saying a lot. There’s little doubt that Stem has been the big winner, with almost $300M invested to date. With its focus on artificial intelligence, aggregation of distributed batteries, and managing demand charges for commercial customers, it makes sense. We’ve also seen a host of energy storage companies get gobbled up by bigger giants eager to get a headstart in the battery game. Enel bought Demand Energy. Wartsila snatched up Greensmith. And Aggreko consumed Younicos. See a longer list here. No one knows what other innovations will make it to market, but we can guess that they will make storage easy and beautiful, take advantage of multiple revenue streams, serve more than one customer, and be loved by utility giants for the grid problems they’ll help solve. Here some other statistics for your next dinner party:
  Project Finance The scale of investments in energy storage project finance will continue to dwarf venture capital investments in the sector. It’s also worth noting that non-recourse financing -- i.e., no corporate or personal guarantees necessary — is on the way. Three big project developers have won this unique benefit of the project finance model: Powin | RES | Green Charge. However, limitations to quicker market expansion for battery project finance revolve around these investor considerations:
Here some other fun facts for your quiz later: 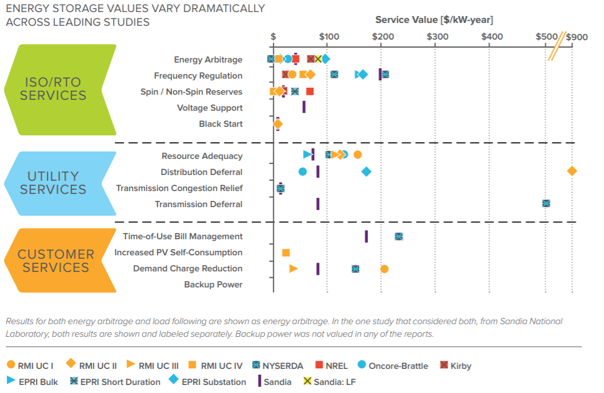 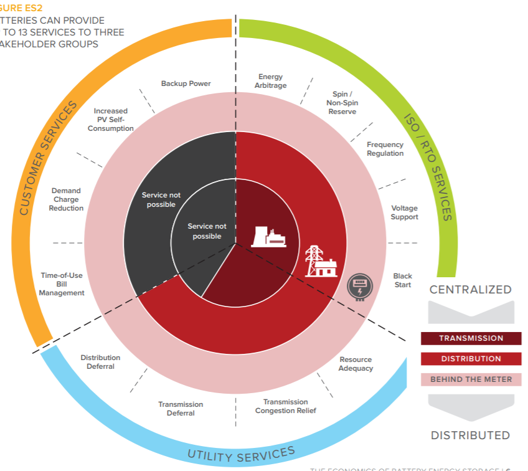 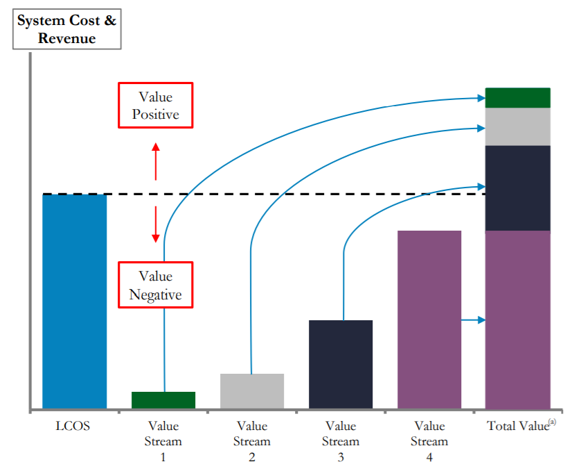 Conclusion If you’re looking for a Blue Ocean Strategy play in clean energy, something with few competitors and new customers, then the time is nearing when you might be late to the party. But don’t run away crying and defeated just yet. With $100B of expected investment in the sector over the next 12 years, “the cup runneth over” with opportunities, whether your cup of tea be VC-stage innovation with hundreds of possible winners to choose from, or perhaps project finance targets for lower risk and much bigger capital deployment. -- Shout out to Thomas Kelley for the cool Volts photo.  By: Dr. Chris Wedding, Managing Partner I recently spoke about investing in energy storage at the SuperReturn Energy investor conference in Boston. In this blog, I hope to pass along 4 of my top 100 takeaways. (OK, slight exaggeration, but productive indeed.) Unfortunately, I am unable to also magically transmit the decadent Legal Seafoods’ lobster tails and sushi rolls from the sponsored dinner (#WeLoveLawFirms) or the conference bling (#MyKidsLoveGiftsFromWorkTravel). 1. Natural gas is misunderstood. First, low commodity prices will not always mean low power prices. The costs of distribution of gas to the power plant, plus the transmission and distribution of the electricity it produces take place on an ancient grid. (That’s a technical term. But Edison would recognize today’s grid if he magically reappeared in his Florida laboratory.) Recent research suggests that the average age for power lines is 28 years, while the U.S. DOE quotes studies by the Brattle Group (for the Edison Electric Institute) estimating about $2T in investment needs for the grid from 2010 to 2030 just to maintain the service reliability. Second, natural gas is not a perfect “bridge” to a low carbon future. On one hand, its emissions factor (pounds of CO2 per BTU emitted when burned) is roughly 43% lower than burning coal (whose butt it is kicking). On the other hand, the operational emissions factor for natural gas is infinitely higher than solar or wind (#DivideByZero). Also, methane leaks during exploration and distribution likely counteract its lower greenhouse gas emissions (compared to coal, that is) when combusted at power plants. As you know, methane’s greenhouse gas impact is at least 30x more potent than CO2. Third, there are two giants in the natural gas ecosystem that see some writing on the wall, and I think they see lots of four-letter words there. GE has laid off 12,000 workers in its power generation business, and now Siemens is considering selling off its natural gas turbine business, whose Q2 revenue was down to $114M from $438M in Q2 2017. And with Bloomberg estimating 157 GW of renewables added vs. just 70 GW of conventional power in 2017, we can understand why they might be making those moves. Having said all of that, I don’t pretend to live in a world of rainbows and unicorns. Conventional energy will likely be part of the global mix for many decades to come. Even in a world where solar and wind power dominate, this analysis shows that natural gas will have a large, though diminishing role over time. 2. $1T of clean energy investment presents challenges for entrepreneurs and investors. Most climate change scientists, policymakers, and private sector leaders project a need for $1T of low-carbon investment needed per year in companies and projects in order to keep global temperature increases below 2o C. However, last year Bloomberg suggests that global clean energy investment stood at just $333B. By my math, that’s 67% lower than the amount of capital we will need. To get there, we need at least two things:
As for investor interest, it is growing. When I first began speaking at the SuperReturn investor conference series three years ago in Boston, London, and Berlin, I was often part of the 1%. (No, not that 1%. I am a pauper compared to my colleagues in attendance who manage billions in capital.) What I mean is that I was often the only guy talking about the future opportunities and threats presented by the mainstreaming of energy storage and electric vehicles, or the continuation of investment opportunities in solar, despite the challenges of (and false conflation with) the cleantech VC missteps of the late 2000’s. Today, many more investment professionals -- with decades on Wall Street instead of roots in the jungles of the Central American rainforest -- are making big investment commitments to renewables, exploring new deals in energy storage, or analyzing the threats that EVs pose to mid- and long-term oil prices. [You can read more here about the mainstreaming of renewable energy investing in my feature piece for Preqin, a global leading for market intelligence for private capital markets.] In contrast to this growing interest, investors worry about yield compression. With lots of capital chasing a disproportionately smaller number of good deals at scale, and with risks being hammered out of renewable energy infrastructure, IRRs have gone down. [Note: Although IRRs are a helpful underwriting metric, many investors prefer to look at the “multiple of invested capital,” or total cash out vs. total cash invested.] When I first began investing in solar power projects, we underwrote to private equity returns north of 20%. Today investors in operating projects might get 6-9%, while those investing in development plus operation and/or platform plays (investing in the development company, too) are targeting “mid-teens” returns. To clarify, these are leveraged returns. And when most oil and gas investors hear this, they laugh a little on the inside when comparing these numbers to their target returns from 20-30%. But this is apples-to-orange, due to risk. Renewable energy infrastructure returns are based on [15-25]-year contracted cash flows, while oil and gas investments often depend on far riskier exploration and development, plus volatile global commodity markets. As for deal flow, scale and quality are the two constraints. Regarding the scale of these markets, things are getting better. For example, annual U.S. solar project installations are up roughly 50% versus just two years ago, and by 2023 total installed U.S. solar capacity is expected to increase by more than 2x. But we still need more entrepreneurs to build more projects and companies worthy of investors’ capital. (A tantalizing call to action, for sure.) Regarding quality, over the years, we’ve vetted 100s of MWs of solar projects. But very few have passed review and made it to investment committees. Again, things are getting better. Developers and entrepreneurs are learning from past mistakes (e.g., using venture capital, the most expensive capital on earth, to built factories to make s*#t). For more about what it takes to increase a company’s chances of raising capital, we’ve written a few primers, structured in numbered lists, with attempts at humor included.
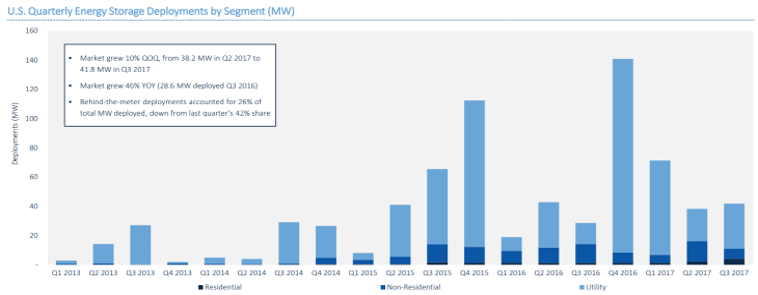
3. We overestimate the impact of new tech in the short-term, and underestimate its impacts in long-term. This quote from Bill Gates highlights a comment from an investor panelist: In the current energy transition, trillions of dollars will be created and destroyed. Another investor put is this way: If you have no strategy on the growing role of clean energy, then you’re leaving value on the table. For my panel on energy storage investments, the topic on most investors’ minds was this: “Is energy storage a real market today?” Opinions varied. But here is the right one: Heck ya, it’s real today. But it’s not real everywhere...yet. Hence the confusion. There are hundreds of millions of investment already committed to or invested in batteries each year at the utility, commercial and industrial, and residential level, including projects involving our clients. Consider these stats from Greentech Media:
To be sure, the bulk of energy storage investments have yet to come. Bloomberg estimates $100B invested by 2030. For a great graph of billions of dollars projected to be invested, check out the black bar graph here. But even today, giants like NextEra estimate that no new gas peaker plants will be built post-2020 due to the falling price and increasing performance of large-scale battery storage. [For more about energy storage investing, you can read our research here -- Financing Energy Storage: A Cheat Sheet.] Despite early indications of massive growth for new clean energy solutions like storage or EVs, most people see them as a long-term thing. Not a material consideration for today’s portfolio. However, this graph from NYT / HBR shows that often new technologies are being adopted on increasingly quick timelines, following S-curves with step change growth, not incremental linear progress. Of course, when comparing EV adoption to smartphone adoption, investors at the conference pointed out that there is a massive difference in the CapEx among these items; hence much slower adoption is possible. But if any fraction of Tony Seba’s projections in his ReThinkX report on the future of transportation are correct (the question may be “when, not if”), then we could be talking about switching from a CapEx discussion to an OpEx discussion, thereby making the mass transition from ICE (internal combustion engine) vehicles to EVs much quicker. According to one investor panelist, this research estimates that most Americans spend about $10,000 per year on their cars, while ReThinkX projects that autonomous shared EVs could reduce personal travel costs by 90% while also delivering convenience, too. (Ah...to relax and work while going to the airport in a Lyft, instead of navigating traffic and crowded parking garages in my own vehicle.) Building on that theme, while at the event, I received an update from Bloomberg on their EV projections for 2040: 55% of new sales and 33% of global fleet. (#ThatAintNoNiche) [Quick aside: Some panelists laughed at the idea that EVs meant clean energy. True, it depends on the grid mix of high vs. low carbon energy sources. But this calculator from U.S. DOE shows that EV CO2 emissions are roughly 50% less than gasoline-powered cars based on average in the U.S. The calculator lets you see differences by state location, too.] Panelists also noted that major adoption of EVs in the U.S. could lead to 2x growth in utility power output, even describing this monumental revenue-generating opportunity as a “w*t dream” for utilities. (And, yes, the room was mostly full of men. I apologize. Just the messenger...) In a time when Moody’s just gave the utility sector a negative outlook for the first time in history, maybe Elon Musk is right: The electrification of transportation could be a much needed savior for the challenged power sector. Considering that the average capacity factor for U.S power plants is roughly 40%, the utility sector has lots of excess capacity in sunk costs to harness with 100+ EV models coming online by 2020. [Background: Most grids tend to overbuild capacity in order to manage peak loads, thereby underutilizing power plants and perhaps wasting CapEx for perhaps 90%+ of the hours in a year.] On a related note, solar plus storage has until recently been an enticing topic for discussions at conferences, or fun projects for my graduate students. But this, too, is changing quickly. Today almost all renewable energy RFPs from utilities in deregulated markets require the inclusion of energy storage capacity. And suprisingly, the bids are coming in at very low prices. As an example, Xcel Energy’s recent process resulted in 10+GW of bids for solar plus storage at 3.6 c/kWh and wind plus storage at 1.8 c/kWh, which are both new record low prices. Finally, investors often feel limited in their consideration of long-term trends and multi-decade infrastructure assets due to the [8-10]-year life of most private equity funds. In response, panelists came out in two camps:
4. Definitions of ESG and sustainable energy vary widely. Despite the concern that ESG (Environment, Social, Governance) or sustainable investing is for hippies who love to earn below market financial returns, many investment giants would disagree. Below are samples of their thinking:
Yet still there is confusion about what the terms mean. Some panelists said their investments in oil and gas have been doing ESG for many years. Now they just needed to add social sustainability goals. However, they were equating ESG with HSE -- Health Safety, and Environment. While there is overlap, and both are important, there is at least one key difference:
Furthermore, some conventional energy asset managers, intending to do better in ESG, described their greenhouse gas footprinting efforts, and believe that that their conventional energy holdings are low carbon. Some said the CO2 impacts of oil and gas investments were very low impact because exploring, drilling, and transporting via pipelines constituted a very small amount of the sector’s air pollution. This is true relative to the combustion of those resources. However, companies are increasingly being expected to consider and account for broader life cycle impacts of their investments, inside and outside of their direct corporate control. In this new world order, a new analogy may apply: Making guns, but not accepting some accountability for gun deaths, could be a dead argument. (Yep, pun and controversy intended.) --- For more short (and sweet?) commentary on clean energy finance, along with tips on productivity, life hacks, and trivia for your next dinner party, check out our (mostly) weekly newsletter -- 2 Bullet Tuesdays. It’s a quick 4-minute read, with bullets and short paragraphs, plus links for you to learn more if you somehow have more than 24 hours in a day. --- Photo by Jesse Collins on Unsplash By: Dr. Chris Wedding, Managing Partner It’s easy to assume that the energy storage market is plagued with technology risks. With over 70 battery chemistries being tested or deployed, it is no surprise that many financiers worry about backing the wrong horse and earning a “goose egg.” However, as the Transformers comic series so wisely noted years ago, this is another situation where there is “more than meets the eye.” (Get your nerd on, and read more at the Transformers Wiki. Yep, it’s a real thing.) In this post, I will call out 7 factors that are projected to make lithium-ion batteries the top energy storage technology through at least 2025. 1. Lithium — Not One, But Many This dominant type of battery is a leader in part because it is not defined by just one type of chemistry. So, the math is not quite fair. Many of these versions of lithium-ion batteries actually compete amongst themselves. Lithium-ion batteries include varieties with cobalt oxide, manganese oxide, iron phosphate, nickel manganese cobalt oxide, nickel cobalt aluminum oxide, and titanate (titanium oxide). Use cases for this smorgasbord of lithium-ion options cover areas of great interest to us at IronOak Energy Capital — such as grid services, demand charge reduction, and EV uses — as well as non-power sector applications such as medical devices and power tools. For more, here’s a good summary from Investing News. 2. Experience with the Technology Lithium-ion is about as innovative as a middle-aged person. (That was meant to terrify all Millennial readers.) But seriously… With roots in the 1970’s, lithium has gone from science labs and discussions of the distant future to billions of dollars of investment and global dominance. In terms of actual energy storage installations, lithium-ion batteries increased their market share considerably: 29% (2012), 40% (2013), 46% (2014), 71% (2015), and 93% (2016) of all batteries installed globally. (Source: IHS and Navigant) The numbers are even higher today. In the U.S., lithium-ion batteries led all energy storage installations for the tenth straight quarter, including a roughly 97% market share in Q1 this year. (Source: GTM) The next biggest player was vanadium flow batteries with 3% market share. 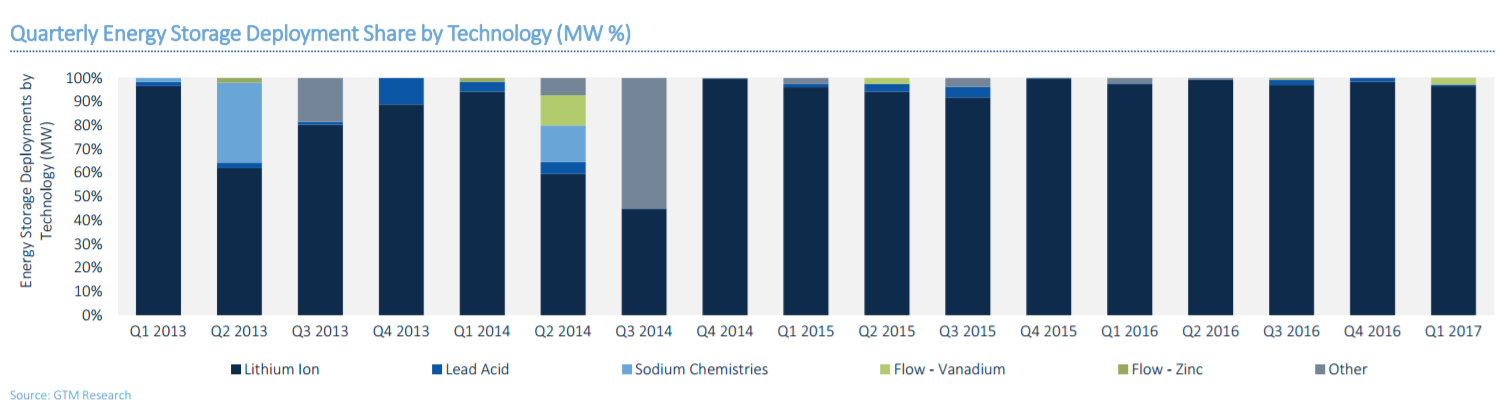 Source: GTM Research
With each additional quarter of lithium’s leadership, the whole host of market players becomes more comfortable with the technology, from regulators and developers to investors and suppliers. Furthermore, costs for lithium batteries have fallen 50-70% since 2010 and are expected to fall another 25-50% by 2020. (Sources: Lazard, Moody’s, Tesla) In addition, each year their performance continues to increase. As such, competitors to lithium face a moving target, one where the bar is constantly rising. 3. Scale of Invested Capital: Divided and Conquered With dozens of lithium-ion competitors trying to win over technology investors, they each receive less capital than they need to scale quickly. Lux Research notes that “beyond lithium” battery companies raise an average of $40M over 8 years. Compare this to the $5B invested in Tesla’s Nevada Gigafactory. Or the three additional gigafactories they announced in February of this year. In addition, this trend is happening outside of Tesla’s magnetic media coverage. Experts suggest Tesla’s factory is only 1 of 12 such factories around the world. In Asia, Amperex Technology, Panasonic, LG Chem, and Boston Power are all planning new lithium factories in China. And Samsung and BYD plan to expand their existing plants. And in Europe, Daimler announced in May this year its own big ole’ lithium-ion battery plant. But it will only cost about $500M. (Yep, sarcasm.) 4. Size of Balance Sheets Startups are known for innovation, being nimble, and disrupting 800-pound gorillas. While exciting, those are also correlated with company-level risk and balance sheets that leave something to be desired. So, if you are the developer and investor in a large stationary battery installation serving the power grid, or the global manufacturer of thousands of electric vehicles, do you choose an innovative startup or an 800-pound gorilla to supply your batteries? Yep, you guessed it. Big and boring wins the day when it comes to scale. As an imperfect proxy, think of large market capitalizations — Samsung ($254B), Panasonic ($26B), LG Chem ($18B), or Tesla ($57B). As they say, “You won’t get fired for hiring McKinsey.” It reminds me of another grim expression: “I want just one throat to choke.” If something goes wrong with those batteries years down the line, you want to be able to … well, you get the idea. 5. Expert Analyst Projections With its considerable inertia, the lithium-ion battery market is expected to continue leading the battery market through at least the next decade. Projections vary, but here are a few to digest:
It’s worth noting that some lithium competitors may have stronger Compound Annual Growth Rates than these projections imply. However, they are starting from a much smaller base so percentages can be deceiving. 6. U.S. Government Projections When countries don’t have what they need, they look for alternatives. (Or go to war. But let’s stay positive.) In terms of known global lithium reserves, the U.S. has roughly 0.3%. That’s not so great when projections suggest $1.4T of U.S. infrastructure could be underutilized over the next 15 years without feasible energy storage solutions. It can also be a limiting factor when electric vehicles hold the keys (yep, bad pun) to managing grid stability as renewable energy penetration grows. As an example, consider that California, the sixth largest economy in the world, is eyeing a new 100% renewables target by 2045. Accordingly, U.S. national laboratories are on the hunt for lithium alternatives. The most notable initiative is Joint Center for Energy Storage Research (JCESR), an innovation hub based at Argonne National Laboratory. So, what is their latest conclusion after considering dozens of next generation battery technologies? Well, one of the two is still based on lithium — that is, lithium-sulfur batteries, which are lighter and have greater energy density than today’s lithium-ion versions. 7. Will Lithium Popularity be Its Demise? You have undoubtedly seen articles suggesting that lithium is a rare metal whose availability will be entirely consumed by Tesla’s Gigafactory. OK, now forget all of that. Let’s talk about the difference between lithium reserves vs. resources.
Quiz time: Fill in the blank.
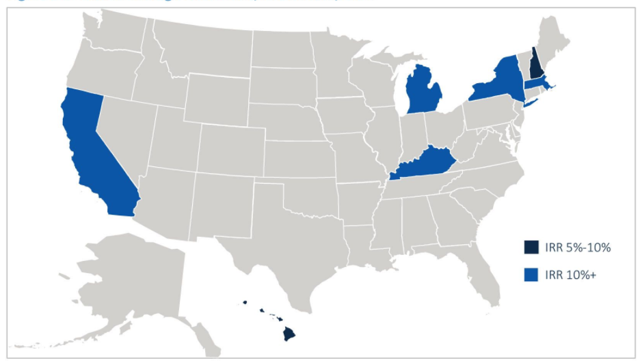
So, which is reserves and which is resources? Duh, right? Resources refers to the lower, much higher number. Reserves applies to the upper, lower number. Moreover, the volume of resources should continue to climb higher as projected future demand for lithium entices companies to invest more in exploration. Now consider some wild numbers from Mr. Musk: The world could be powered 100% by clean energy if we had the storage capacity output form 100 gigafactories. If true, and if you assume that the full volume of resources is static, then experts suggest we would still have enough for 50 years of lithium supply. In Conclusion All in all, no one can predict the future. But it’s nice when many prognosticators are saying similar things: Lithium batteries make up 97% of new installs in the U.S. (and similar dominance globally). In addition, the seven factors above suggest that its market appeal is likely to continue into the foreseeable future. That said, lithium-ion batteries are not perfect. For example, their maximum duration is four hours of storage. Yet experts suggest that in the years ahead power markets will demand longer duration batteries that allow for over four hours of capacity. Some even call for seasonal storage — think multi-month capacity. And lithium batteries are also not perfectly scalable. So, a 5x increase in size may not mean a 5x increase in power, as would be the case for a flow battery. But keep in mind that the perfect is the enemy of the good when it comes to controlling market share. By: Dr. Chris Wedding, Managing Partner The storage market is projected to grow over 100x from 2013 to 2022. That’s great. Let’s go celebrate. Or maybe the famous William Gibson quote is worth highlighting: “The future is here — it’s not very evenly distributed.” When it comes to battery storage, that “future” today is defined as Hawaii, California, and the Mid-Atlantic (i.e., PJM power territory), with some random outliers such as Kentucky and Michigan as well. However, the financial feasibility of energy storage will grow quickly. Analysts project that commercial storage pencils today in 7 states. But that number is projected to rise to 19 U.S. states by 2021. (Minor footnote: The assumption for that math is that investors accept a 5% IRR. I hope that will be true. But today our investor network suggests a higher return threshold, perhaps in the mid-teens.) Battery costs are, of course, a key driver. So let’s consider four trends for investors to keep in mind. 1. Energy cost is not the most important driver in assessing financial returns “Wait, what? But you just said that costs were critical.” Let me explain. Capital costs get most of the attention in discussions about energy storage investment opportunities. And there’s good news: Prices are falling quickly. (Statistics below) However, capital costs are not the only consideration in achieving an attractive IRR. Instead, here is the key question. (Be prepared for some rocket science.) Is value greater than cost? As the Lazard figure below illustrates, when “stacking benefits” from energy storage projects, more and more project opportunities will begin to make financial sense. These benefits, or potential revenue streams, can include grid benefits (e.g., regulating frequency, deferring major capital cost upgrades) as well as host-user benefits (e.g., lowering demand charges on power bills). Unfortunately, policy and technology are still barriers to the realization of multiple sources of revenue for the same storage system. Both are slower to adapt to market possibilities than entrepreneurs and investors would like. Energy Value Proposition: Value vs. Cost (Source: Lazard) 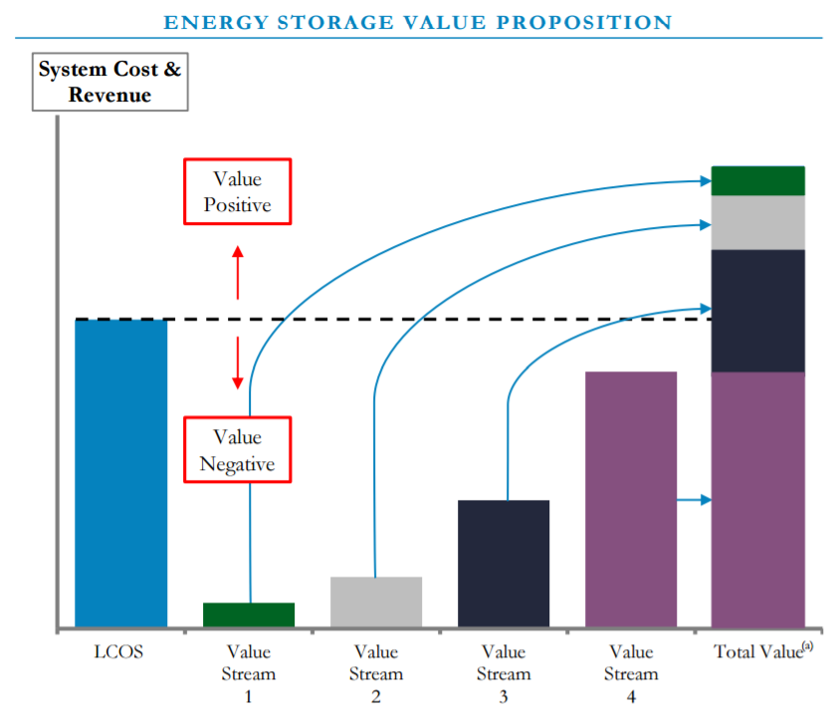 Furthermore, if you’re coming from the wind or solar industry, it’s helpful to remember that energy storage is not an industry where one size fits all. There is not one energy storage market. There are many. Finding battery investment opportunities that make sense require the right match among technology, geography, utility territory, customer, and business model. (See the figure below.) Energy Storage Feasibility: The Nexus of Technology, Market, and Business Model (Source: Deloitte) 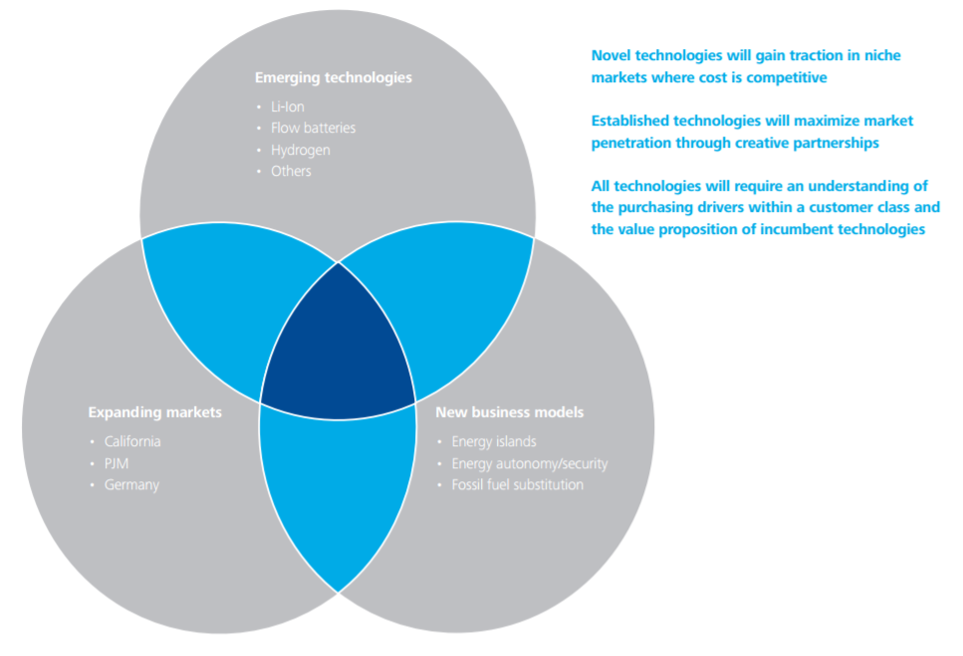 2. The costs for batteries has fallen about 50% since 2010 According to a 2015 Moody’s report, energy storage costs have fallen by half in the last six years. They predict “significant market impacts” for power producers. But even greater costs reductions have been seen in recent months. For example, over the 18 months prior to June 2016, energy storage provider Stem saw a 70% reduction in their costs for batteries. The falling prices can be attributed to a number of factors, such as the overall scale of production among all manufacturers, the volume of production on an individual company basis, and the balance of supply versus demand. 3. Storage costs are projected to fall another 25-50% by 2020 First, be aware that storage cost projections vary depending on the technology (e.g., lithium, flow, flywheel, sodium, zinc, compressed air) and the use case (e.g., commercial, residential, microgrid, island grid, transmission-level, peaker replacement, frequency regulation). Below is a snapshot of expected storage price drops on an annual and five-year basis. The outlier, not included in this chart, comes from Telsa. (Are you surprised?) Its Nevada-based Gigafactory is expected to drive down the costs of its lithium-ion batteries by at least 50% by 2020. Average Projected Energy Storage Cost Reduction: 2016-2020 (Source: Lazard) 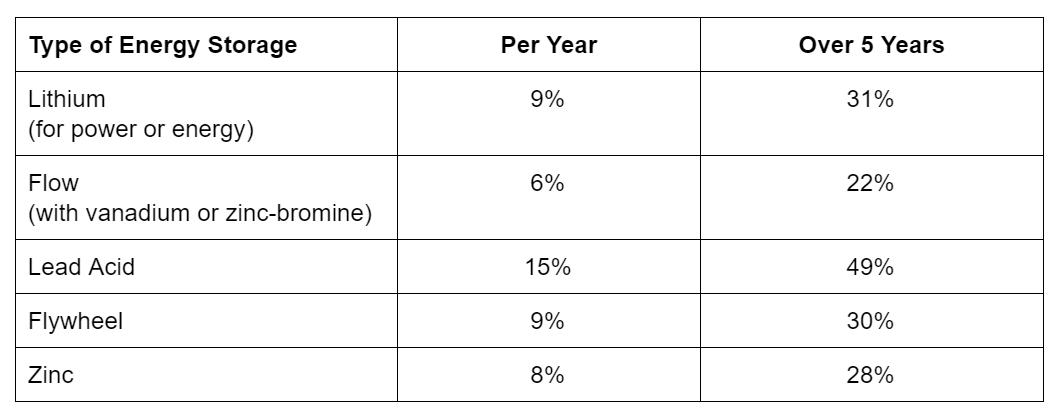 4. Battery cost dynamics are closely linked to electric vehicles in two ways First, let’s be clear: We’re just talking about lithium-ion batteries. (Apologies if you’re now shaking your head saying, “Duh, of course.”) First, lithium batteries will fall, in part, because EV sales have increased dramatically in the last five years — a nearly 600% increase in annual sales between 2012 and 2016. Furthermore, EV sales are poised to grow more significantly in the years ahead. BP predicts 100 million EVs by 2030, for a 6% market penetration, while other analysts project 15% to 35% market penetration, where EV sales account for 8 out of 10 new car purchases. See the two graphs below. And be sure to compare the EV sales for 2016 on both graphs. Wow, indeed. Get your motors running… Just like we see in so many sectors, with greater scale comes lower costs for all lithium batteries, not just those for EVs. (Again, common sense comes in very handy.) Annual EV Sales: 2010-2016 Source: EV Volumes PEV = Plug-in EV 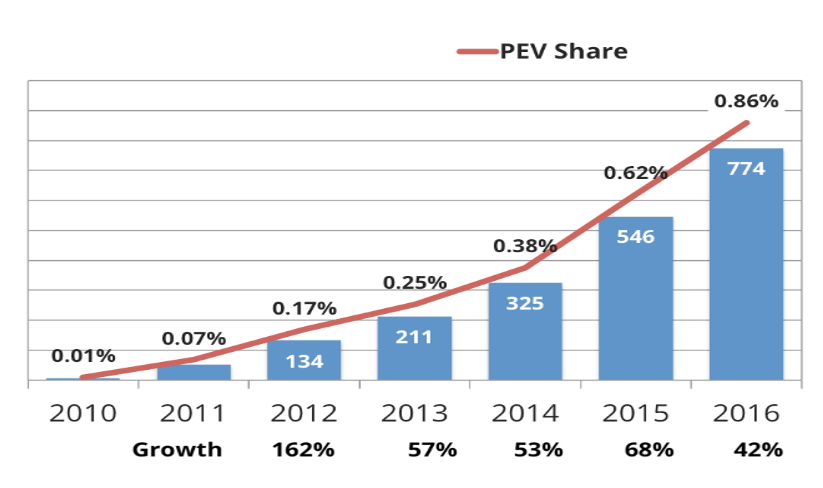 Correlation: Projected Cost for EV Batteries vs. Growing Demand for EV Source: BNEF 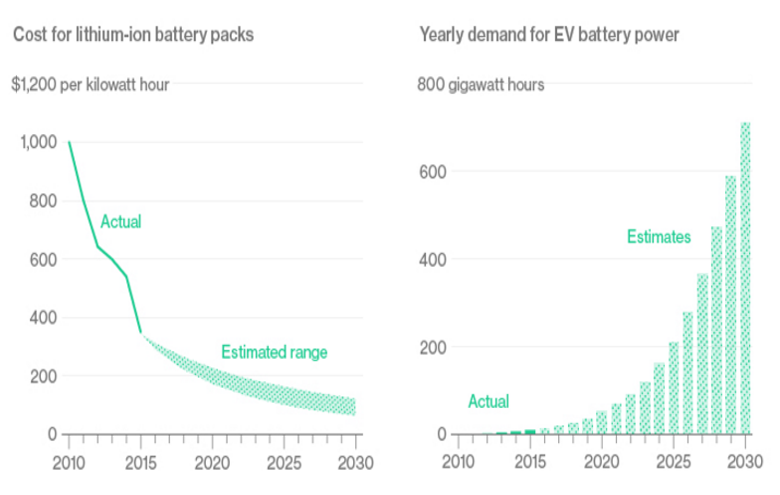 The second reason that battery costs and EV sales are connected is this: Like U.S. Marine drill sergeants, EVs demand a lot from their batteries. Once the battery capacity gets below about 75%, the EV needs a replacement. But the battery still has lots of useful life in less intensive applications, such as stationary uses serving the grid, industry, or homes. Car companies like BMW and Nissan are already working on second-life uses for their EV car batteries for the home storage market. It seems like an obviously great idea — preserve that supply-constrained lithium, don’t throw away a perfectly good technology, and most importantly, get cheaper batteries for the masses. But, it’s not that easy. (Is it ever?) How do you combine used batteries from different manufacturers? Or those from the same manufacturer but made in different years with different technology? How do you assess useful remaining battery life in a non-invasive manner that doesn’t destroy part of the battery in the process? How do you ensure safety? And get relevant warranties and insurance needed for selling thousands of second-hand systems? Conclusion Energy storage costs have fallen about 50% since 2010, and are projected to fall another 25-50% by 2020. That said, costs are not the sole determinant of investor interest. The value of storage systems is severely constrained today because policy and technology has not yet enabled the potential multiple revenue streams from the same under-utilized storage systems. But that is changing. So, will you dip your toe into the energy storage market today? Or will you wait for it to make progress on its 100x market growth trajectory between 2013 and 2022? Said differently… How do you feel about the risks today versus the risks tomorrow, when there are far less technology and policy challenges, but far greater competition to invest in the best projects? By: Dr. Chris Wedding, Managing Partner 1. Investor interest in energy storage is high — perhaps irrationally high Enthusiasm around the energy storage sector is more feverish than ever. This is simultaneously encouraging and concerning. Important questions remain. Here are a few:
Despite such rationale thinking, many investors want in on the action. Consider the statistics below from the website AngelList, a trusted resource for angel and venture capital investors. 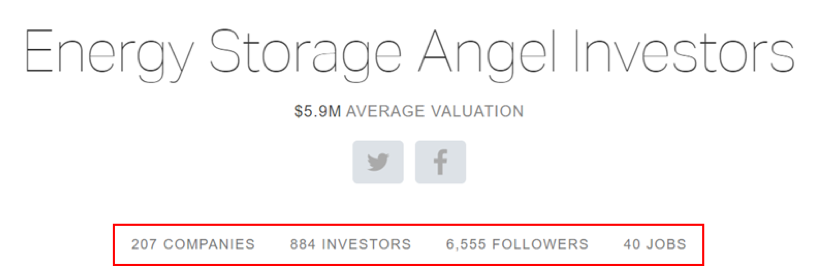 2. Most battery investors are angel and venture capital investors — for now Technology — both software and hardware — are today’s investment focus. As such, angel and venture capital investors drive this discussion. The table below from the witty and savvy data scientists at CB Insights offers a great summary of who’s investing in energy storage technology. 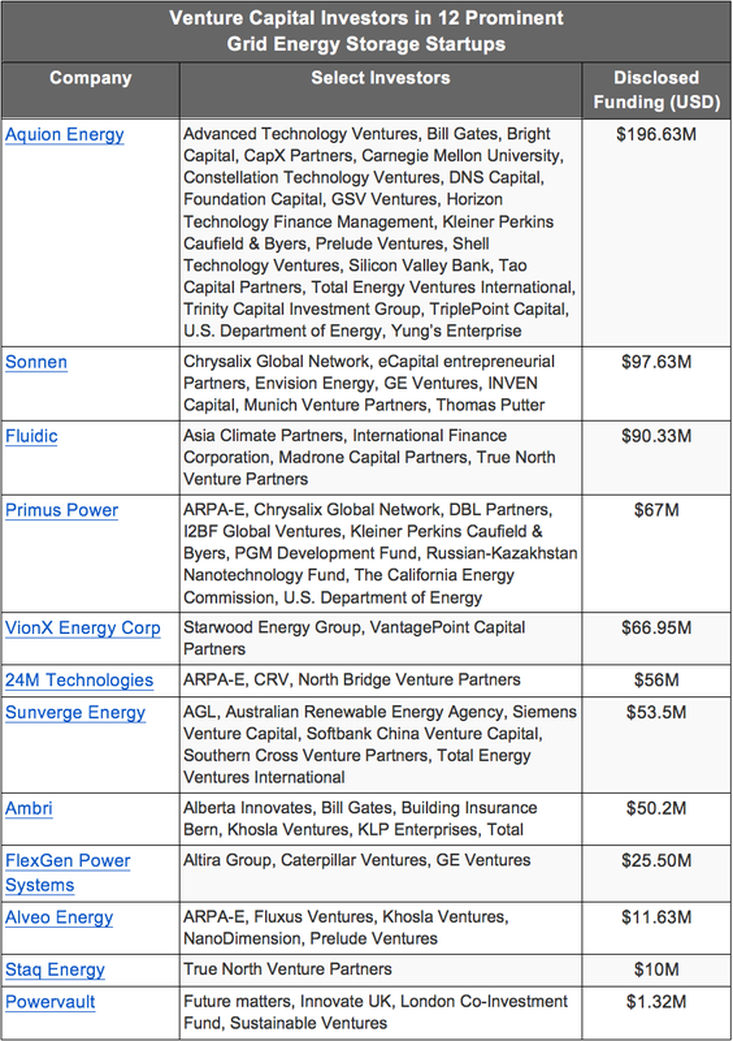 (Source: CB Insights) 3. Project financing for batteries is coming — albeit slowly Given the industry’s youth, examples of infrastructure investment in this sector are hard to find. However, energy storage projects, not technology, will receive the vast majority of capital in the years to come. Let’s look at two examples of investors deploying capital for battery project finance. The table below is compiled using data from the good folks at GreenTech Media and Crunchbase. 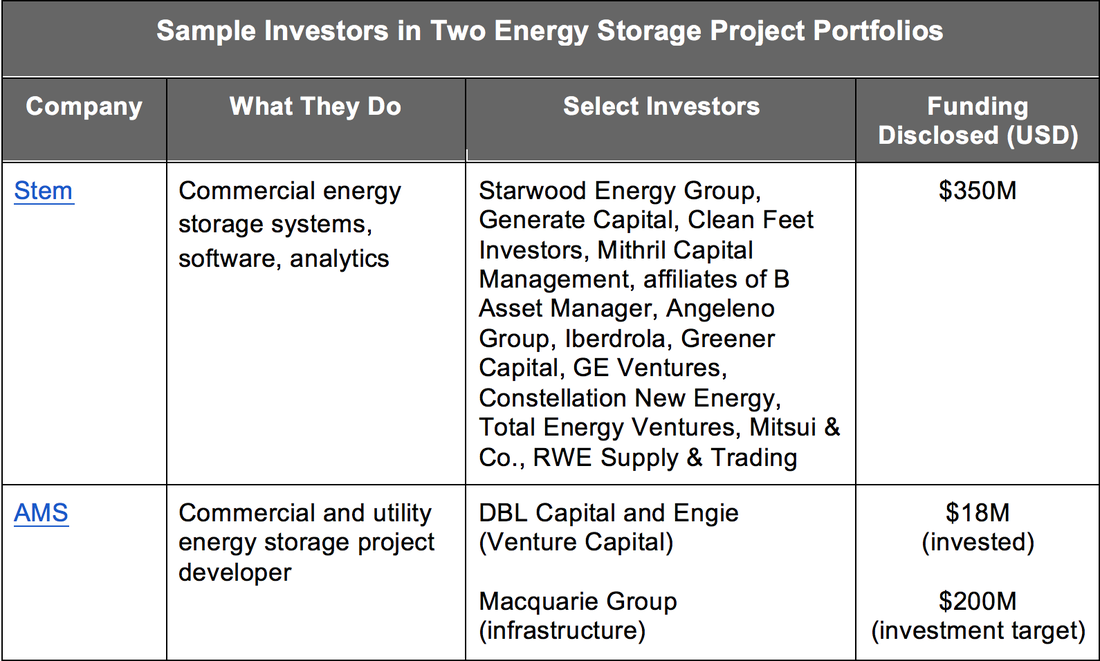 (Sources: GreenTech Media, CrunchBase) As the costs of batteries continue to fall roughly 10% per year, and as technology performance and warranties improve, more debt and infrastructure investors will get into the game. Bloomberg’s graph below illustrates how fast prices have fallen for batteries used in vehicles. Cost Decline for Electric Vehicle Battery Packs: 2010-2015 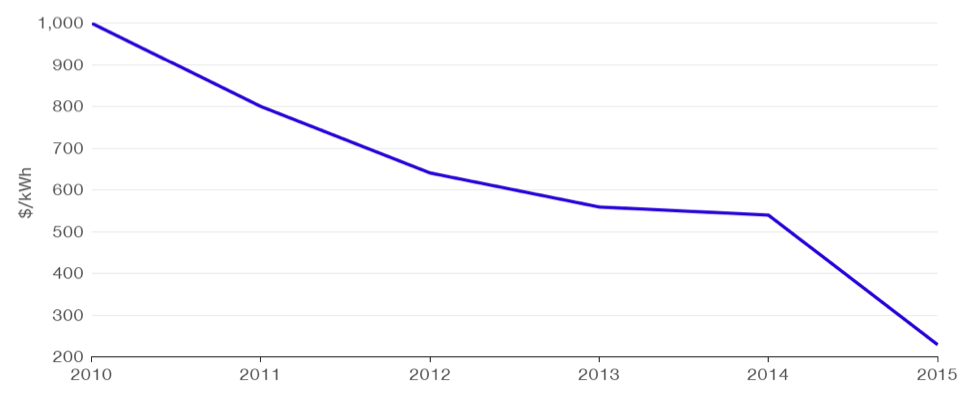 4. Oil and gas majors want a piece of the energy storage opportunity As an article at OilPrice.com put it, “Who cares why the [global] temperature is rising?” Said differently, regardless of where an individual, investor, or company stands on the issue of climate change (**), the opportunity to profit from the shifting global energy mix is very attractive, if not historic. Consider McKinsey research which projects that the global energy storage market could be worth $90B to $635B by 2025, depending in part on adoption of electric vehicles. Or take a look at the figure below illustrating how Total, one of the world’s seven supermajor oil and gas conglomerates, is investing in energy storage, amongst its broader renewable energy investments (e.g., 66% ownership in solar powerhouse SunPower). Total’s Investments in Energy Storage and Other Renewable Energy 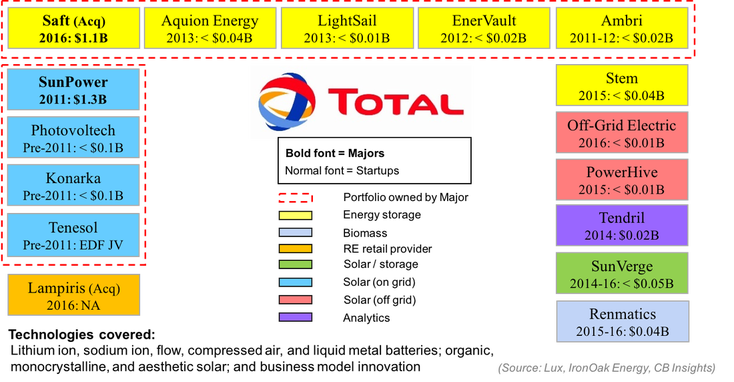 Other oil and gas giants are also making bets on energy storage, such as:
** We are not climate change scientists, but we defer to those who are: According to the US federal government (NASA), over 97% of actively publishing climate scientists agree that climate change over the past century is extremely likely due to human activity. Moreover, at least 18 of the world’s leading scientific organizations (e.g., US National Academy of Sciences) have issued public statements endorsing this position. 5. Lithium batteries are not the (only) opportunity When I speak to investors about the energy storage market, many are worried about technology risk. While the Energy Storage Association tells me there are over 70 battery chemistries being tested or deployed, research shows that there is just one dominant family of battery chemistries. Lithium-ion batteries made up 96% of all batteries installed in the US in 2015. More importantly, as the market demands batteries with longer duration, installations may shift away from lithium-ion, which are typically discharged in increments of seconds and minutes or perhaps two hours, to longer duration batteries, such as flow batteries. GreenTech Media’s projections below illustrate how investors may want to think about growth segments and technology as the market shifts from largely utility-scale installations to almost half of storage deployments taking place behind the meter. US Energy Storage Installations (MWh, left) & Battery Duration (hours, right): 2015-2021E 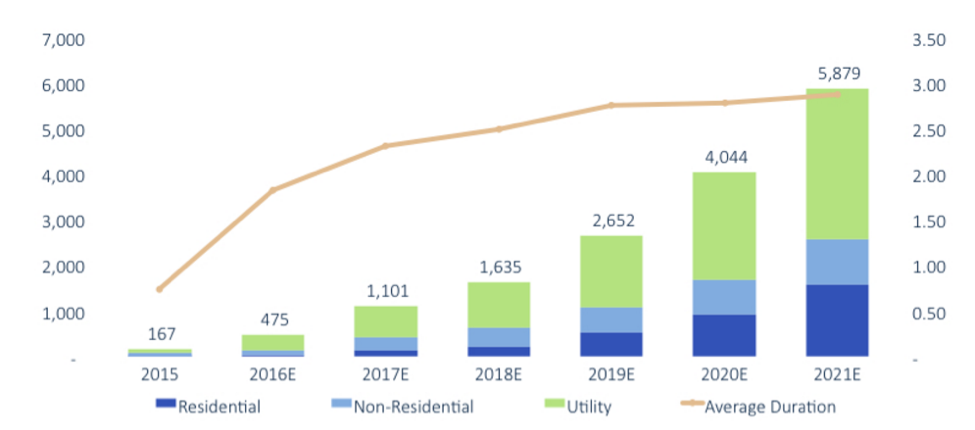 (Source: GreenTech Media)
Conclusion If industry soothsayers are correct, and the energy storage market today is where the solar market was in 2005, then we could see substantial investment opportunities in this sector. But do not jump in with both feet. Warranties, balance sheets, developer assumptions on revenue and cost, track record, and policy enablers all require an extra set of eyes. (And, yes, we would be happy to help on that front.) 11/18/2016 The Mainstreaming of Renewable Energy Infrastructure Investing - Risks, Returns and Emerging SectorsRead Now If you work in renewable energy or infrastructure finance, then you might like this... Yesterday, I published an article in the Real Assets Newsletter for Preqin, a global leader in market intelligence for the alternative assets investment industry, serving 40,000 investment professionals in 90 countries. See the link below. It's on page 8. "The Mainstreaming of Renewable Energy Infrastructure Investing - Risks, Returns and Emerging Sectors"  Here are two highlights... Figure 1 shows the attractive risk-return of infrastructure vs. other asset classes. Note that renewable energy made up 54% of all infrastructure deals globally in Q3 2016. 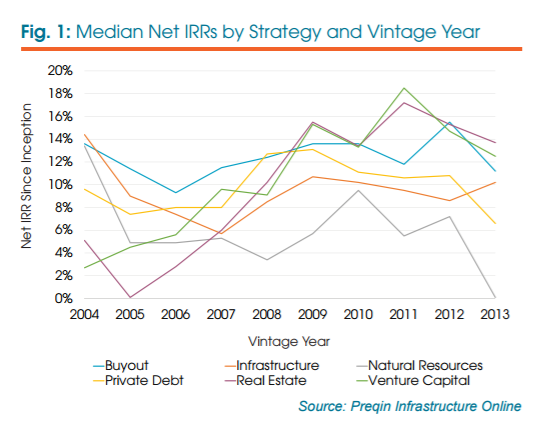 Figure 2 illustrates that solar projects in the developing world tend to be larger (i.e., allow for greater volumes of capital allocation) and generate higher IRRs (albeit with more political and other country risks). 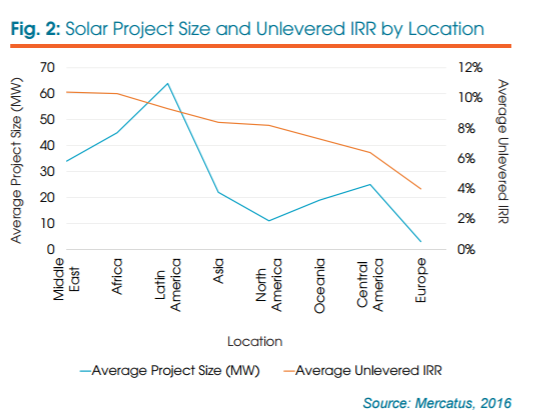 What does it all mean for investors? It's time to look forward, not backward. Most perceptions about renewable energy are outdated because the sector is changing so quickly. Those wait run the risk of being late to the (raging) party.  You may have heard of phrases such as “The Internet of Things” (IoT) or the “Smart Grid.” Both terms are defined differently by many people. According to IBM, the IoT refers to the “digitization of the physical world.” According to the U.S. Department of Energy, the smart grid can be defined as “a [new] class of technology to bring utility electricity delivery systems into the 21st century, using computer-based remote control and automation.” The investment opportunities in improving the intelligence of our electricity generation, transmission, and generation system can be summed up by a joke reserved only for energy geeks (like me). It goes like this: “If Thomas Edison were alive today, and you showed him a smart phone, he would be blown away by the innovation. In contrast, if you showed him how we produce and distribute electricity, he would say, ‘Oh yeah, I recognize that.’” As an example of the scale we are talking about, estimates suggest that the U.S. alone needs to invest US$2.1T by 2035 to upgrade its electrical grid and integrate the massive surge in renewable energy and the need for greater resilience. (International Energy Agency, 2016) As an example of what is coming, consider analyst predictions that the number of internet-connected devices globally will grow from approximately 13 billion in 2015 to almost 39 billion in 2020. (Juniper Research, 2015) Or consider the scale of the opportunity in the infographic below.  Source: Mario Marales, IDC Considerations for infrastructure investors:
9/26/2016 U.S. Energy Storage Market to Grow 8x by 2020: What If It Had Its Own Special Tax Credit?Read Now 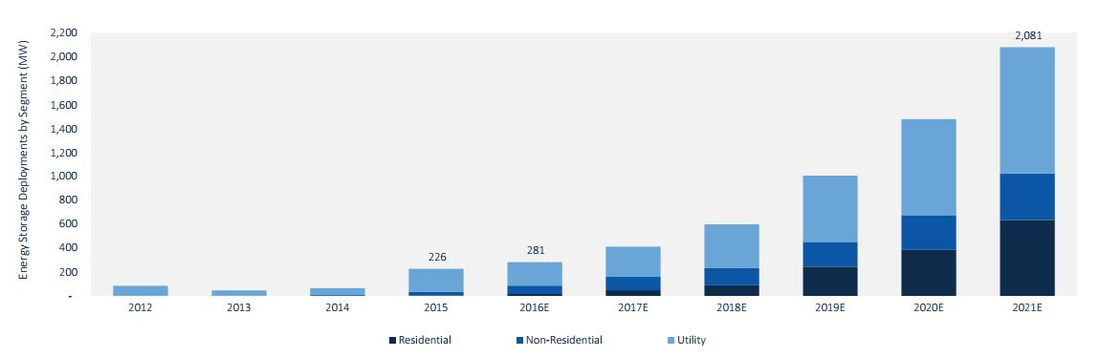 Source: GreenTech Media Can the energy storage industry withstand the scrutiny of having their own ITC? It cannot be understated how transformative an energy storage ITC would be for the industry. At IronOak Energy, we have written previously on the impact of such an ITC, and even presented a positive take on its potential rollout. Here, I want to pose the question of whether the industry is really ready for such a game-changing policy. The graph above shows projections for the growth of energy storage development under the current policy regime. Not too shabby. But is the energy storage industry prepared to put that delicious tax equity to good use on stand-alone energy storage projects (in practice, solar + storage applications currently qualify for the solar ITC)? Of course, the answer is always: it depends. Depends on what? Some would argue that the critical issue holding back a tidal wave of energy storage projects is the technology. One could easily view the vast array of energy storage technologies vying for prominence with some trepidation. Some are commercially viable, while many are not. It takes some brainpower to suss out the contenders from the pretenders. Even the smarties at MIT have a tough time doing it. Do we want the government to incentivize the deployment of technologies that may not be ready to contend for the main stage? Conversely, is that precisely the role we want the government to take? The double-edged sword of government subsidy This is a classic double-edged sword phenomenon. On one edge, there are green grassy fields of opportunity in rolling out new storage technologies in commercial applications. Accelerating storage deployment will drive down costs and help evolve viable business models. Beautiful. Lurking on that other edge is the distinct possibility that many storage technologies in earlier stages of development will simply fail. And failure is bad press, even if it is the Darwinian process of technological progress. It puts the government in the untenable position of having subsidized a “reckless” experiment with taxpayer dollars. “Picking winners and losers” they will say, even though an ITC is designed to avoid precisely this potential conflict. And, let’s just say that there is a history of nasty repercussions for such interference with the so-called free market for energy (ahem - myth). Solyndra - need I say more. Some will say that Solyndra was blown out of proportion (it was) AND it was 5 years ago (a lifetime ago in the clean energy industry). To top it off, Solyndra was backed with loan guarantees, not really what the ITC is about. Details, details... But now, the vengeful energy gods have gifted us SunEdison. It was an altogether explicable collapse, but one that, nonetheless, provides ammunition against government support for the clean energy industry. Who knows what would have happened with the extension of the solar ITC if SunEdison has filed for bankruptcy in 2015 rather than 2016. So, be careful for when you wish upon your industry the scrutiny of being a target of government support. Technological risk is a red herring -- it is really all about how to finance storage Sure, risk exists with many energy storage technologies. Even the most established battery technologies lack the operational history to assuage the concerns of investors looking at decadal time horizons. If you are absolutely intolerant of risk, go invest in government treasuries (just kidding - terrible idea). Just running down the ladder to the cheapest storage technology fails to capture the complexity of the underlying value proposition. Cost is king, but there are many other factors competing for a role on the king’s court. Energy storage technologies cannot be reduced to a simple efficiency or production metric, as with solar or wind (even that is an oversimplification, but at least a reasonable one). There are more than a dozen potential services that could be generated by a given storage technology, many of which have few established market mechanisms to generate reliable revenue. So, here’s the central takeaway. The biggest challenge in the energy storage market is not how to choose the right technology. It is how to design the right market structures to support financial innovation. Making energy storage bankable is close to being a precondition for the successful utilization of an ITC. Recall that the success of the solar PPA model hinged on stable, contracted cash flows. Making solar bankable unlocked a vast market potential that we are still in the early stages of witnessing. There is no equivalent financial structure with energy storage, yet there remains a distinct need to create consistently financeable project cash flows. But wait, SolarCity and Tesla (perhaps soon to be joined in holy matrimony) pioneered a solar + storage PPA earlier this year. The energy storage industry needs a financial product the equivalent of a PPA, and perhaps we are not too far off. Thus far, it has taken a savvy, not mention risk tolerant, investor to back energy storage projects. There is only so much runway with this sort of approach. Easing the path for new investment in storage will hinge on making this inherently complex technology and market application simpler. There are already frontrunning markets generating experiences that will guide future market design and development - thanks, California. In tandem with this type of market development, energy storage needs a greater degree of standardization of financial strategies and structures to help make projects pencil. And not just for the smartest guys in the room, but for a broad swath of interested investors. The question remains as to whether an energy storage ITC will aid or inhibit such progress. Related Reading:
Related data points:
Congress is again considering an energy storage investment tax credit The proposed H.R.5350, known in short form as the “Energy Storage Act of 2016,” seeks “To amend the Internal Revenue Code of 1986 to provide for an energy investment credit for energy storage property connected to the grid, and for other purposes.” Sponsored by Silicon Valley’s Congressman Mike Honda (D-CA), the bill has bipartisan co-sponsorship from Reps. Tom Reed (R-NY), Chris Gibson (R-NY), and Mark Takano (D-CA). As reported, it also has the full support of the Energy Storage Association: “The bipartisan Energy Storage Act of 2016 would unlock competitive access to investment in a more resilient and efficient modern electrical grid by expanding the investment tax credit (ITC) to include all types of advanced energy storage,” according to ESA Executive Director Matt Roberts. We’ve seen public support for energy storage tried before at the national level, such as with last year’s push to pass a national storage mandate. The current initiative builds on earlier efforts for a storage ITC. For example, in 2013 Sen. Ron Wyden (D-OR) proposed a bill that would have granted a 20% tax credit for systems above 1 MW/1 MWh and a 30% credit for smaller 1 kW/5 kWh systems. A potential $2 billion for energy storage The details are as follows. A 30% investment tax credit is allowed for any “qualified energy storage property” (see below). Two billion dollars would be set aside in total credits for the life of the proposed program, with any single storage project capped at $40 million. As a side note, under these constraints it makes sense to assume that energy storage project developers would be incentivized to keep total project size under a $133 million price tag. What qualifies? At a first reading there does not appear to be a capacity size requirement for any large project, as long as it is used for one of the following purposes: 1) peak demand management; 2) deferral or substitution of investments in generation, transmission, or distribution; 3) backup for variable generation; 4) transmission or distribution grid reliability; 5) end-user energy consumption management; or 6) disconnection of load from the main grid. All energy storage technologies are also covered, including mechanical, electrical, thermal, and electrostatic. Small residential storage would qualify as well, if installed at primary residences and used for peak energy reduction for primarily onsite consumption. These systems must have a 5 kWh capacity and the ability to deliver 1 kW of electricity over 4 hours. What doesn’t qualify? In general, non-residential energy storage that is designed primarily for on-site consumption does not qualify, unless it exceeds a 5KWh energy capacity and the ability to discharge 1 KW for 5 hours. Special exceptions are given to both pumped hydro and compressed air storage -- these projects must begin construction and operation within set timeframes or risk losing the credit. Supporting storage? Two points to consider The first point to consider is that -- to the extent to which energy storage is paired with renewables -- it may be under-supplied in the current market and deserving of public support. A study that was released in-press last week in Applied Energy from researchers at the University of East Anglia is garnering a lot of attention. In the article, “The value of arbitrage for energy storage: Evidence from European electricity markets,” researchers simulate the arbitrage value of price-taker pumped hydro and compressed air energy storage under different market characteristics and across a portfolio of energy trading strategies. Not surprisingly, decisions can be made to maximize these values across different conditions. More significant was a summary conclusion: “Government subsidies should be used to encourage investment in energy storage systems if renewable power is to be fully integrated into the sector…” The second point is that a separate energy storage ITC is not the only pathway to support energy storage. Some storage is in fact already eligible for the solar ITC as long as it follows strict rules about explicit pairing with and charging from solar power generation sources. As seen below, we already know that energy storage is expected to receive a huge boost from the extended ITC for solar, whether or not it takes advantage of this limited opportunity under the solar ITC. U.S. Storage Deployment Paired with Renewables Differential vs. No Extension 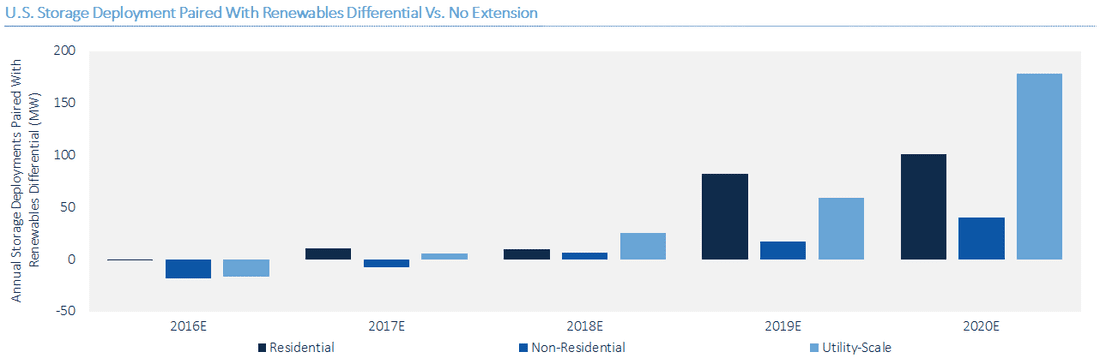 (Source: Greentech Media)
The current IRS rules on storage eligibility under the solar ITC have been described as “ambiguous.” In February, the IRS issued a request for comments on this issue, with observers hoping for further clarification in future letters. Regarding the eligibility of storage, the required pairing with renewables was seen as necessary in order to avoid subsidizing storage that was existing merely to arbitrage with the grid, rather than serving as a support for renewables. Conceivably the IRS could decide to expand storage eligibility under the existing solar ITC, but this seems like a case of trying to fit a new effort (storage) under a policy for which it was not designed (solar power promotion). The good news is that the new proposed energy storage ITC excludes subsidizing projects that exist merely for arbitrage. Allocation of the credits across projects would be determined by the DOE, to choose those that maximize the following metrics: reliability or economic benefit, integration of renewable resources on the grid, or efficiency of grid operations. H.R. 5350 is just beginning its path from bill to law, but the possibility is there for an energy storage ITC to complement the existing solar ITC. Which ducks do you see?The California Independent System Operator (CAISO) can be commended for providing an accessible daily data dump on renewable usage across its system. With these data one can construct various “duck curves” for the grid’s daily net load profile, the shapes of which result from the rising penetration of a variable energy resources (VER) such as wind or solar. VERs exhibit four characteristics:
Duck curves are in essence the daily net load profiles after accounting for VER generation. They show the required remaining dispatchable energy required to ramp up or down to take up the solar and wind shortfall. As we see from the two examples below, duck curves can take on various forms, often depending on the scale range of the y-axis. 1st flock of ducks: Average net load profiles over seven days around March 31, over 2013-16. 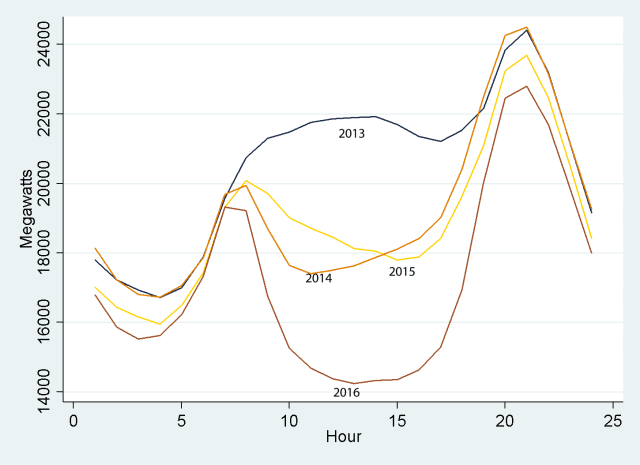 Source: Blog post by Meredith Fowlie, “The Duck Has Landed” (5/2/16), using CAISO data. 2nd flock of ducks: Net load profiles for March 31 for 2012 and 2016. Forecasts for 2017 and 2020 were made in 2013. 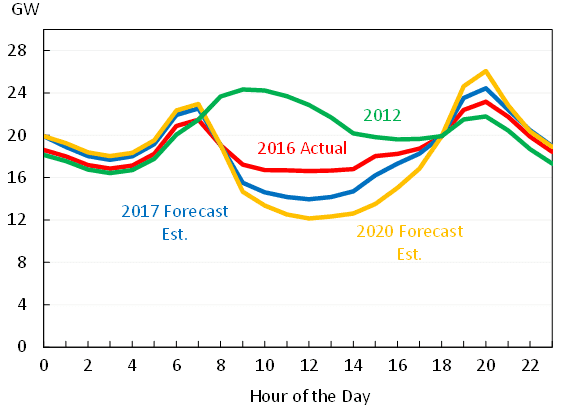 Source: Council of Economic Advisors, The White House, “Incorporating Renewables into the Electric Grid: Expanding Opportunities for Smart Markets and Energy Storage,” Fig., 4 (June, 2016), using CAISO data.
Both sets of curves cover almost exactly the same sets of data, with the first emphasizing a more extreme story. The the stories are essentially the same -- net load after VERs bottoms during the day when solar is peaking, ramps up very quickly as solar generation drops off dramatically and evening usage rises, and then drops again as nighttime usage drops and wind picks up. The takeaways are two:
Ancillary services as regulation mileage A recent report from the Council of Economic Advisors at the White House goes deeper, looking at some ways of understanding the value of energy storage via the idea of regulation mileage. The concept measures the changes -- increases or decreases -- in power output that a grid operator requests from an electricity generation resource over a specific timeframe. It would stand to reason that regulation mileage, a proxy for the amount of ancillary services required, would be determined by several factors. The Council’s study looks at the total load, the amount of that load from VERs, the slopes of each of those load curves, and a series of effects that are specific to the hour of the day, day of the week, and week of the year that the electricity is generated. Among other results, and as expected, one of the clearest that appears is that the slopes of the load and VER generation have a lot to do with the services required. In other words, the faster the late-afternoon ramp up at the end of a sunny day, the more energy storage will be wanted. Valuing storage based on its ancillary benefits What are other approaches to valuing energy storage in these settings? The peer-reviewed journal Nature Energy recently carried the results of a new study on capturing the full benefits of energy storage in investments. Applying a techno-economic model, the authors of ”Limiting the public cost of stationary battery deployment by combining applications,” find that battery storage becomes more attractive as an investment as each storage facility offers more energy services. An article summary carries the message that energy storage apart from pumped hydro is, “still considered unattractive by investors on mainly two grounds: cost-competitiveness with other technologies and the absence of a commonly shared classification of electrical storage as a competitive or regulated activity -- that is, as an electricity generation asset or network component” (emphasis added). The drawn conclusions are that the best way to incorporate all of these benefits are to remove non-market barriers, a legacy of rules that were originally written for conventional generators. According to the summary, these “institutional and regulatory frameworks are key elements in the determination of the economic value of storage,” and “economic principles require new, enabling rules to be technology neutral, that is, not directed at the diffusion of storage or any other technology in particular.” The article calls for three such policy recommendations:
This policy neutrality from above is a point worth repeating. In revising public policies, the goal is not the promotion of energy storage out of any favoritism towards the technology. Rather, the point is to promote energy storage as an enabler for VERs such as solar and wind, which in turn leads to progress on an overall societal goal of reducing greenhouse gas emissions. Annual U.S. Energy Storage Deployments, 2012-2020E 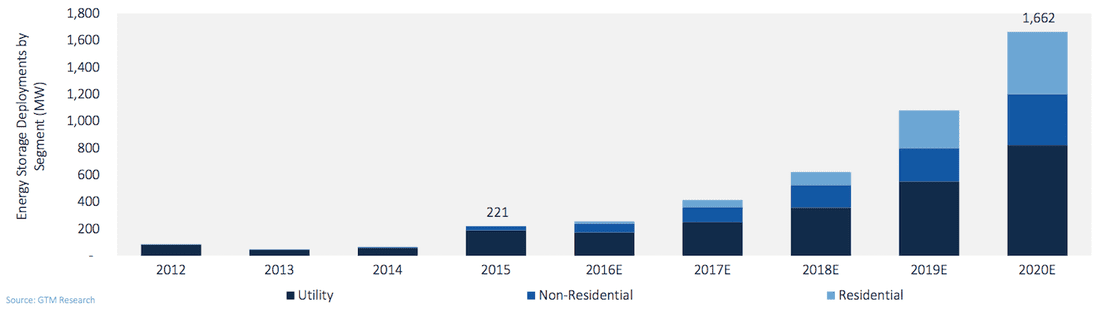 Can somebody throw the energy storage industry a bone? It is a little known fact that the investment tax credit (ITC) was a key catalyst for the emergence of solar as an essential component of the future electric grid. Well, not really. That statement borders on platitudinous. It should be no surprise, then, that the energy storage industry is angling for similar treatment by the almighty tax deities at the IRS. Energy storage, after all, is touted as being a key enabler of high levels of renewable energy penetration. Handcuffing energy storage will only undermine the grid integration of solar and wind down the line. So, can the energy storage industry get a bone here? Yes, it is a relatively nascent industry (at least in battery technology) undergoing a rapid period of technological learning and experimentation. But out of the frey, we are starting to see some dominant technologies and applications emerge within functional markets. While lithium ion batteries are the current industry darling, there are many other viable storage technologies including stored hydropower, which still dominates the energy storage field overall. In the periphery, there are a host of other storage technologies incubating in R&D facilities, start-up companies, and corporate technology giants. Perhaps in response to the eventuality of energy storage becoming a key component of the electric grid, the IRS threw the energy storage industry a bone, but it came with some strings attached. Energy storage already qualifies for the ITC, right? Yes and no. Yes, energy storage already qualifies for the ITC, but no, it is does not qualify under all circumstances. Energy storage that is powered by solar or wind qualifies for the ITC, though with some caveats related to the extent to which grid electricity is also used to charge the energy storage system. This is where things get a little tricky. Assume that you have an off-the-grid solar + storage facility (a grid defector!). Simple - the ITC applies, and you can get on with your homesteading. But for all grid-connected systems, there is an upper limit to how much charging your storage system can receive from the grid and still qualify for the ITC. That magic number happens to be 25%, meaning that a whopping 75% of energy storage charging needs to come from solar. That is just the minimum standard for qualifying for the ITC. The full ITC benefit is reduced in proportion to the amount of energy input coming from the grid, so anything less than an energy storage system charged by 100% solar will receive less than the full ITC benefit. Add to string the fact that solar + storage projects are benchmarked to the first year’s solar power output for the subsequent four years of the tax benefit, which means that any reduction in solar output will be penalized with a lower ITC benefit. And all of this was articulated in a private letter, which does technically establish a precedent, but is a somewhat opaque way to communicate what could be a substantial benefit to the energy storage industry. See here for a clever dive into the details of solar + storage. Stand-alone energy storage ready for an ITC vaccination It is clear that coupling solar (or wind) with energy storage is a good idea, and will be done with increasing frequency over time. It is also clear that energy storage will not and should not be relegated to the sidelines of the ITC prom waiting for some attention from the solar and wind dancers on the floor. In fact, it is imperative that energy storage be granted a clear and clean invitation to the ITC prom independent of their relationship to solar and wind, when and where appropriate. If the aim is to reduce barriers to more energy storage development providing flexibility and ancillary services to the grid, then there is a pretty obvious argument to be made about the need for a little ITC vaccine for stand-alone energy storage. Why a vaccination? Well, energy storage, like many emerging clean energy and smart grid technologies, could benefit from an inoculation against investor skepticism. There is no shortage of bullish projections about the future of energy storage, yet many project developers find themselves searching for capital. Even when they land upon a willing investor, their investment often comes with a heavy cost of capital penalty due to the perceived risks and uncertainties associated with energy storage projects. Not unjustified on the part of the savvy investor in search of those ever elusive risk-adjusted returns. But also not the formula for ramping up energy storage deployment, which, after all, is the key to sussing out technologies, business models, and financing structures. Learning, in other words, which is exactly what the ITC has been doing solar all of these years. Roping in stand-alone energy storage projects into the ITC framework could be just what can get investors over the hump of really going gangbusters on energy storage. In a previous blog, we reviewed how pumped hydro storage still dominates all storage technologies in the United States, with the existing capacity of 20,356 MW expected to grow by 20% with an additional 4,150 MW. Thermal storage is projected to add 302 MW of rated power to an existing 553 MW (an increase of 54%), electro-chemical approaches will add 602 MW to the existing 405 MW (+148%), and electro-mechanical technologies will add 706 MW to the existing 169 MW (+418%). How does the global picture look? We refer again to results obtained from U.S. DOE’s Energy Storage Database. The figures below show the somewhat dramatic transition between the “old” (existing operating capacity) and the “new” (projects that have been announced, contracted, or are under construction) in energy storage projects around the world. Old school made new: A pumped hydro renaissance? Pumped hydropower looks at the new-fangled batteries and other technologies coming out with regularity, and feels like a person out of place at a hipster bar. But this technology, which has been around since it was first used in Italy and Switzerland in the 1890s (soon after the world’s first hydroelectric dam began operations in Wisconsin in 1882), remains the overwhelming leader in the energy storage arena, both in existing and future capacity. Indeed, with newer variable speed pumps that are better able to coordinate with electric grid needs, a pumped hydro storage renaissance may be under way. 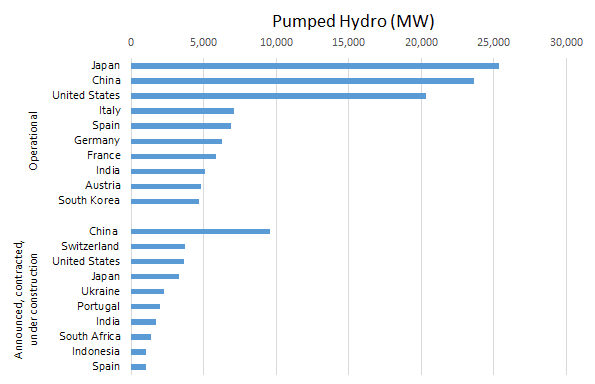 (Source: DOE Energy Storage Database, data downloaded 4/29/16) From the figure above, Japan, China, and the United States are the clear top three in this area, and each are making significant new builds along Switzerland. The scale of pumped hydro is impressive, as new projects in less developed countries such as Ukraine and India represent a higher capacity addition than those from all other technology types and all other countries. All in on the newer energy storage technologiesThe electro-chemical category includes all of types of batteries (e.g., flow, lead acid, lithium ion, metal air, sodium-based, and zinc air) as well as electro-chemical capacitors. From the chart, the United States is the clear leader in this technology type, and its capacity is expected to more than double. Other nations that have already bought into battery storage are projected to buy in even more, such as Japan, China, and Chile, with relative newcomers like Italy, The Philippines, and Kazakhstan jumping in strongly for the first time. 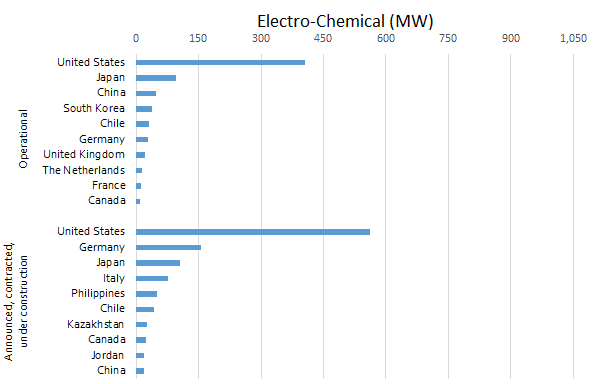 (Source: DOE Energy Storage Database, data downloaded 4/29/16) Current electro-mechanical storage applications, which include compressed air storage, flywheels, and gravitational systems such as railcars, have been tried at scale only in Germany, the United Kingdom, and the United States. And while these three top the areas with new capacity coming on, a larger set of new countries are testing the waters, though admittedly at a very small scale. 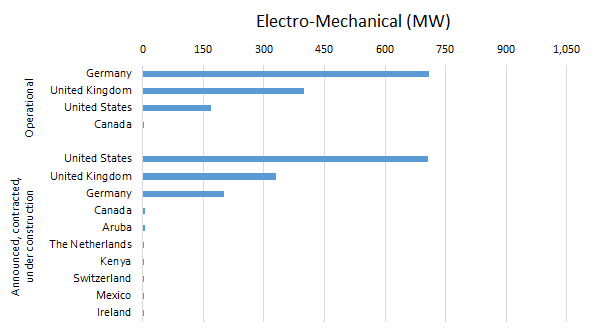 (Source: DOE Energy Storage Database, data downloaded 4/29/16) Thermal storage (e.g., ice, molten salt, and other approaches) has also been dominated by three countries—here, Spain, the United States, and South Africa. Here too the technology is diffusing across a much wider array of countries, with most outside of the original top three starting basically from scratch. 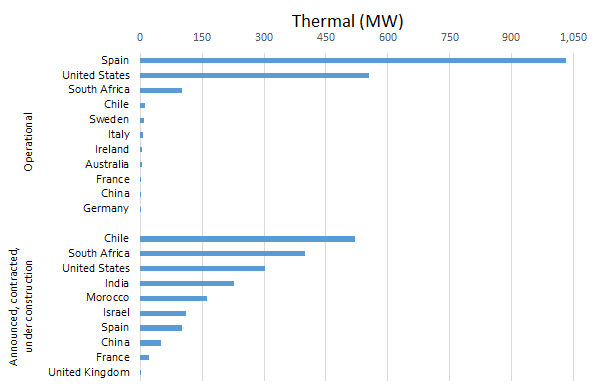 (Source: DOE Energy Storage Database, data downloaded 4/29/16) Finally, by way of comparison to the other energy storage approaches, global hydrogen storage is miniscule, as the total of listed projects includes 2.7 MW in Germany and 0.2 MW in France. The method is straightforward—excess electricity is sent through a Proton Exchange Membrane (PEM) to electrolyse water into hydrogen and oxygen. The hydrogen can be stored on-site (as with a “wind to hydrogen” concept for wind turbines) and then later either sold and fed either into pipelines for grid electricity production or used directly for on-site electricity generation in a fuel cell. (It can also be sold for use in fuel cell vehicles, or as an input in ammonia production). Although the base is low, this method of storing energy is expected to more than double in global size, with Canada, Italy, and Germany developing an additional 2, 1.2, and 0.8 MW, respectively. Many future energy storage leaders are starting from scratchIn the final two graphs below, we see the total rated power of energy storage by the leading countries, including both existing capacity (in blue) and capacity expected to come on line soon (orange). As noted before, pumped hydro skews the results. At left, which includes pumped hydro, China, Japan, and the United States will remain the dominant players in energy storage overall, with significant capacity additions expected for these countries as well as Switzerland, which will more than double its storage capacity. Other nations in Europe—like Spain, Italy, Germany, France, and Austria—will be relatively stable when it comes to total energy storage.
(Source: DOE Energy Storage Database, data downloaded 4/29/16)
At right, taking out the pumped hydro data, notice first that the y-axis scale has dropped by an order of magnitude! In this non-hydro arena, the United States is the clear global leader. Also notable is that many countries are almost starting from scratch to build energy storage capacity in these non-hydro technologies, including Chile, South Africa, India, Morocco, and Israel, while Germany, the United Kingdom, and Japan will be making significant additions. The lessons? If you’re in the battery or other non-pumped hydro storage areas, be aware that efficiencies are improving in pumped hydro that may be worth paying attention to, at least at the international level. And of course if you’re in the pumped hydro field, you have some new competitors as well. Further reading: Energy storage offers too many behind-the-meter benefits to consumers and grid operators to not become a common, if not essential, part of commercial PV projects. The myriad benefits of energy storage validate the basis of a beloved food analogy: “Energy storage is the new bacon—it makes everything better.”
The consumer-centric benefits are the most widely discussed, and they usually focus on shaving peak demand by reducing costly demand charges for commercial customers. In addition to mitigating demand charges, solar plus storage allows end users to benefit from time-of-use bill management, backup power availability, and increased PV self-consumption. Moving up the food chain, utilities can use energy storage to achieve resource adequacy, transmission congestion relief, and transmission deferral. Finally, Independent System Operators, or ISOs, benefit greatly from energy storage predominantly by increasing frequency regulation, but also via voltage support and energy arbitrage. PJM’s Atlantic-coast-to-Illinois territory became the first ISO to provide monetary incentives ($40-$50 per MWh) for grid-scale storage that directly addresses frequency regulation. On a related note, let’s talk about those scary “death spirals.” The U.S. energy storage market will be 8 times bigger in 2020 than it was in 2015, reaching 1.6GW of installed storage capacity. By 2020, the utility death spiral will have fully taken hold and grid defection will be occurring all over the country, right? I think not. In 2014, I contributed to a Rocky Mountain Institute paper called The Economics of Grid Defection, which seemed to briefly serve as a crystal ball for the nascent energy storage industry. But no more than two years after the report was released, even a modest amount of grid defection seems highly unlikely given the proactive efforts by utilities nationwide to design pilot projects and sustainable policies that integrate solar plus storage with existing grid infrastructure. The energy storage market will begin to resemble more of a shared economy rather than an increasing number of grid-defected silos. The availability of storage devices, both directly from the ramped up manufacturing as well as second-hand batteries from electric vehicles, will provide a sustained supply of storage assets to expand grid storage capacity. These are both compelling sources of affordable storage assets, and certainly a reason to believe the repeated headlines regarding anticipated drops in energy storage costs. The solar plus storage revolution is being driven by cost effectiveness and scalability, two key drivers that provide a strong signal for future growth. Navigating murky waters: Accessing the ITC for solar + storage projects It’s inevitable that developers compare the benefits of energy storage to the well understood benefits of solar PV systems. The reality is that the technology for deploying and optimizing energy storage is much more complicated than solar, which impacts the bankability and clear financing strategies needed for exponential capacity growth. Prioritized revenue streams from solar plus storage projects include basic kWh production from PV, in addition to the benefits derived from stored, dispatchable electricity when rates are peaking to shave off much more demand charges than solar could have ever done on its own. Aside from contracted revenue from the end user, determining the ability for solar plus storage projects to qualify for the 30% ITC (Investment Tax Credit) is a critical factor for getting projects to hit desired investment return thresholds. Solar plus storage installations qualify for the 30% ITC, but developers need to pay close attention to system design to ensure that the intended cost basis appropriately applies to the ITC’s rules and regulations. A few key insights include:
For most EV businesses, the details of solar project development and operations are a related but distant world. Similarly, to solar developers and investors, the EV market is interesting, and most of them want to own a Tesla (including me), but integrating the two industries is a bit of a leap. However, some of us are wearing both hats. At IronOak, we simultaneously supply solar project investors and developers, as well as EV market makers, with research and transaction advisory services. In fact, at this moment, we are working on hundreds of MWs of solar projects and fleet roll outs totalling thousands of EVs in major U.S. cities. As one example, I serve as an Advisory Board member for Paul Allen’s Vulcan, Inc. in its innovative partnership with the U.S. Department of Transportation Smart City Challenge, which will award $50M to a single city to help electrify its transportation network. A report this month by the German Renewable Energy Federation highlights the massive potential link between the EV and solar markets. Estimates suggest that second-hand batteries from the world’s nearly 90 million EVs sold by 2030 could provide 1,000 GWhs of power in stationary uses such as integrating renewable power into grid, homes, and businesses. Apparently, when EV batteries get below about 80% of their original capacity, which occurs roughly 6-10 years after they’re first used, it’s time to replace them. Yet they might still have 10 years of life left. If true, this is important for two reasons:
For a sense of the scale of this opportunity, as well as how fast the cost of storage is falling, consider the graphs below, based on Navigant and Deutsche Bank projections. 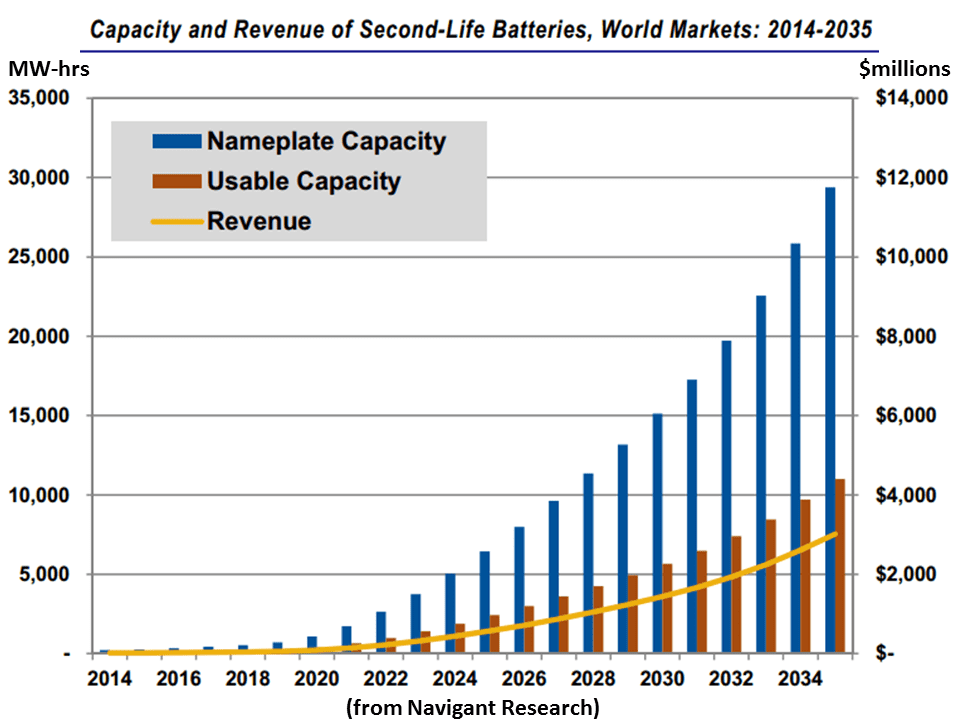 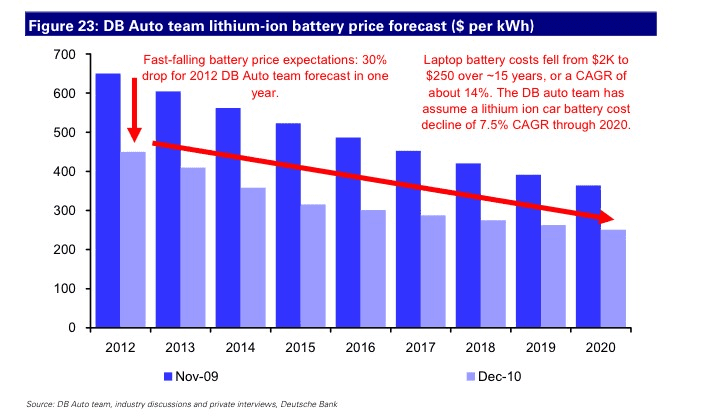 Revenue risk: More than amount and number of sources, it’s about certainty No surprise, investors and banks like some predictability—less for the former and more for the latter—in the revenues and costs of the projects they own. The same logic applies to energy storage investments. However, with at least 70 different battery chemistries being tested or manufactured at some scale, many believe that technology risk is the main barrier for battery roll out. Yet lithium ion batteries accounted for 96% of (chemical) storage added to the U.S. grid last year. As such, it’s the ability to forecast revenue, not remove technology uncertainty, that is the key to growing this nascent market. Scanning the figure from RMI below, it is clear that batteries provide many services at the transmission, distribution, and DG scales. One would assume that each of these would also create revenue for energy storage project owners. But you know what they say about assuming, right? The Urban Dictionary tells me that certain body parts are involved in the saying. 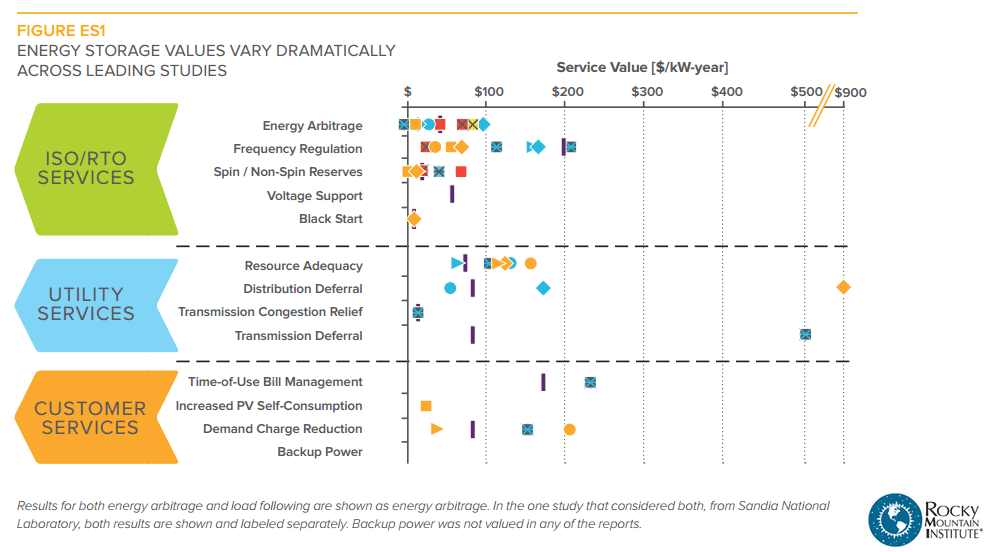 While the amount of potential revenue from multiple sources is appealing, it is not often possible in project structures. But it can happen. As an example, we have originated and are helping to underwrite a $100M-plus energy storage portfolio for a large international investor right now, and this projects makes financial sense because it is “stacking” several sources of revenue, and creating contractual certainty for some of these sources. To further illustrate this potential stacking of revenue, consider the November 2015 levelized cost of storage analysis by Lazard (below). They rightfully stress that their study does not look at revenue stacking, but this is exactly what is required to make more battery projects financially feasible. However, as I learned from talking to a public utility commissioner recently, utility regulations to allow more of these battery services to be monetized are not making it onto the radar of utility commissions because the market is still so small. Alas, we have a chicken and an egg... 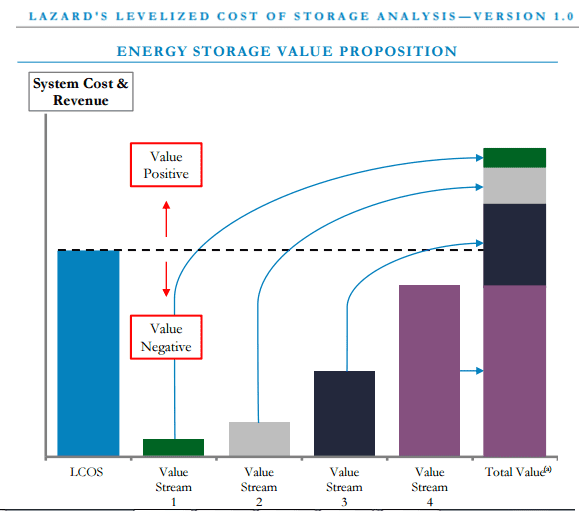 The U.S. DOE’s Energy Storage Database is a powerful tool available to assess the current state of the global energy storage market. Built by Sandia National Laboratory, under an ongoing contract with Strategen Consulting, the database allows for searching and filtering across both storage policies and projects, in the United States and globally. Here we take a closer look at what the data can show us about the energy storage project pipeline. “Energy storage” encompasses a wide array of technologies, applications, and public policy inducementsFor policy analysis, the user is able to sort and filter according to the following criteria:
Four major energy storage technology families can be distinguished, including:
The U.S. energy storage pipeline: Pumped hydro still dominates, but its position is weakening The total rated power capacity of currently operating U.S. energy storage comes to 21,484 MW. (Over the years, 15,584 MW has been decommissioned, and 7,684 MW is currently offline or under repair). This U.S. capacity will grow by 5,760 MW in additional energy storage capacity, going by those projects that have been announced, are contracted, or are under construction. 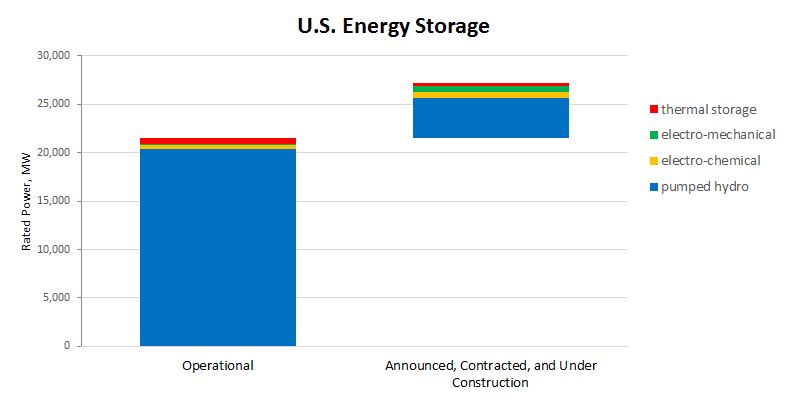 (Source: DOE Energy Storage Database, data downloaded 3/20/16) We see that pumped hydropower storage remains the giant in the field, with a pipeline of 4,150 MW of rated power to add to existing operations of 20,356 MW. However, among the technologies, it is growing the slowest, adding only 20% of capacity. Thermal storage is expected to add 302 MW of rated power to the existing 553 MW (an increase of 54%). Electro-chemical approaches will add 602 MW, a rise of 148% over the existing 405 MW of rated power capacity. The most dramatic pipeline growth, relative to existing capacity, is with the electro-mechanical technologies such as compressed air storage and flywheels, a finding that runs counter to prevailing assumptions in the market. An additional 706 MW of power capacity is expected to come on line in this area, an increase of 418% over the present capacity of 169 MW. 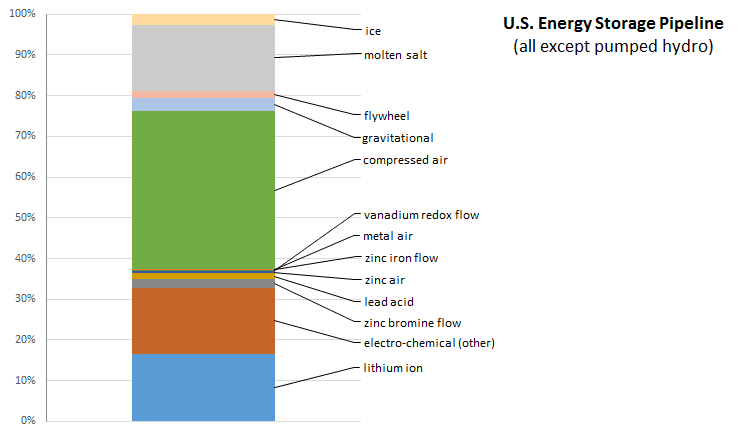 (Source: DOE Energy Storage Database, data downloaded 3/20/16) At the top of this chart we see the thermal projects that have been announced, contracted or are under construction. Next are the clusters for electro-mechanical and battery technologies. No projects are listed for sodium-based or zinc manganese dioxide batteries, or for electric capacitors. What is the takeaway message for investors? Future tendencies may not all be about batteries, and one would be wise to consider all available energy storage applications, depending on the project needs. Finally, where in the United States are most of these projects headed? According to research by CleanTechnica, California is leading the way, likely due to the recent state-level energy storage mandate. 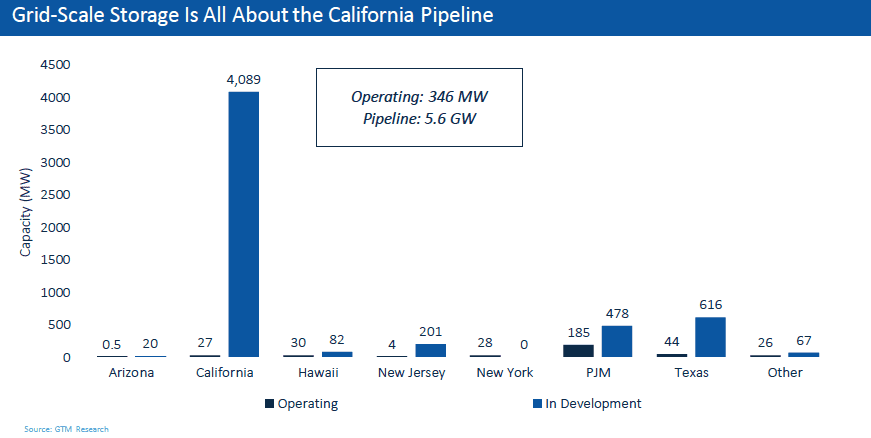 Related data points:
Yes, we agree - energy storage is confusing. There are over 70 new battery chemistries being tested or manufactured today. And batteries are just a subset of energy storage more broadly; remember flywheels, pumped hydro, and compressed air? Consider the fun graph about technology maturity on the following page to be further confused. However, if you are providing financing, guarantees, or warranties for energy storage systems, note that the market has validated just one battery technology: Lithium-ion. This chemistry made up 96% of all 2015 energy storage installations by capacity. This is not to say, however, that your energy storage investment strategy over the long term is without risk. Consider three supply chain risks regarding lithium. These may cause a shift to other battery technologies, such as flow batteries: Source: Depending on the year, very little lithium is harvested in the U.S. Moreover, production is controlled largely by just 3 - 4 major companies, which some refer to as an oligarchical structure. Energy Storage Technology by Maturity 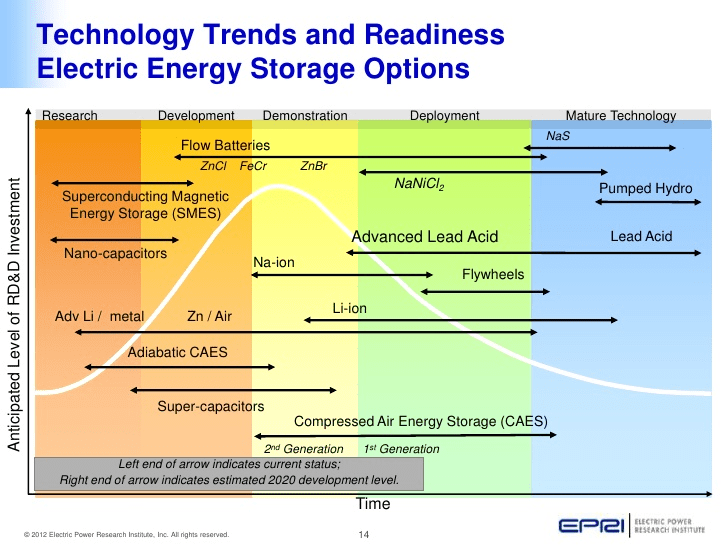 (Source: EPRI) Demand: Global demand for lithium is expected to grow 2x by 2025; as one example, Goldman Sachs suggests that new Tesla Gigafactory alone could consume 17% of current supply. Consider the graph on the following page showing the link between electric vehicle market growth and falling battery costs, which make up ⅓ of car costs. Supply: There is no shortage of lithium reserves. According to the USGS, even if the world increased lithium production 3x from today’s levels, we would still have 135 years of supply. However, what we care about is not reserves but instead the amount of lithium that can be brought to market in time to match the rapidly growing demand from energy storage for grid management, peak shaving, smartphones, laptops, and the many other uses for this precious mineral. And experts suggest that supply will stay below demand for years to come. Lithium Production by Country 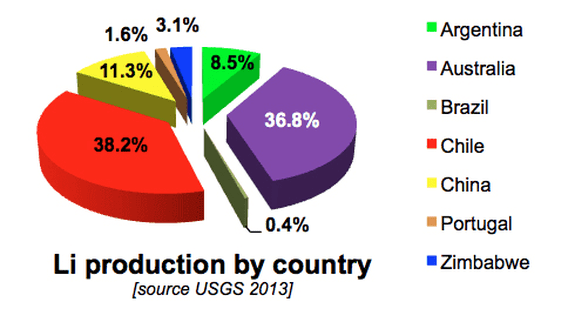 Source: U.S. Geological Survey Falling Lithium-ion Battery Packs (left) vs. Annual Demand for EV Battery Power (right) 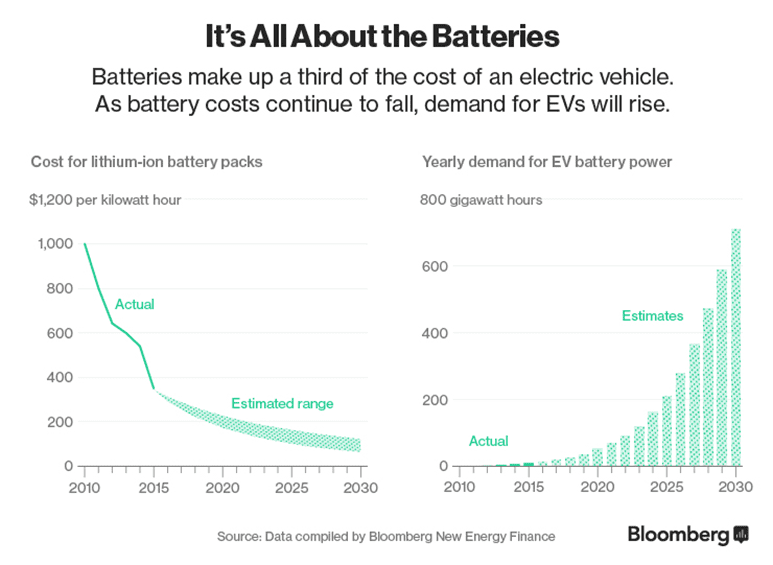 Energy storage investment opportunities are vast, but they are not all the same First, let’s take a look at the big picture: Consider GTM’s U.S. energy storage highlights from 2014 and 2015 (on the next page). Here are five things that stand out:
Energy Storage Scorecard 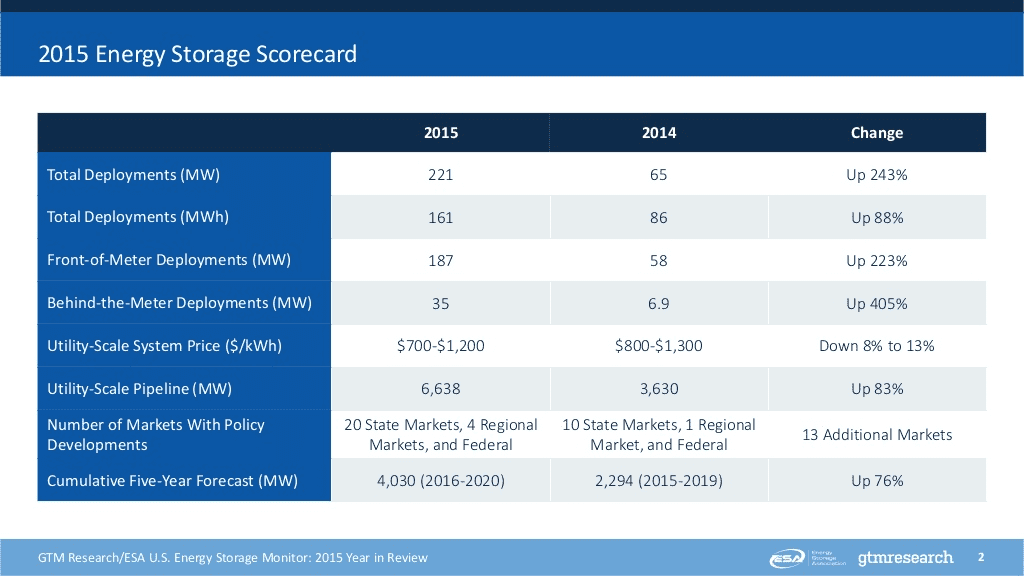 (Source: GTM) As another source of variation in this market growth, consider the graphs below and on the next page. While utility-focused systems dominate today, by 2020 the split becomes more comparable among utility, commercial, community, and residential applications of energy storage. Energy Storage Investment by Sector: 2012 to 2020 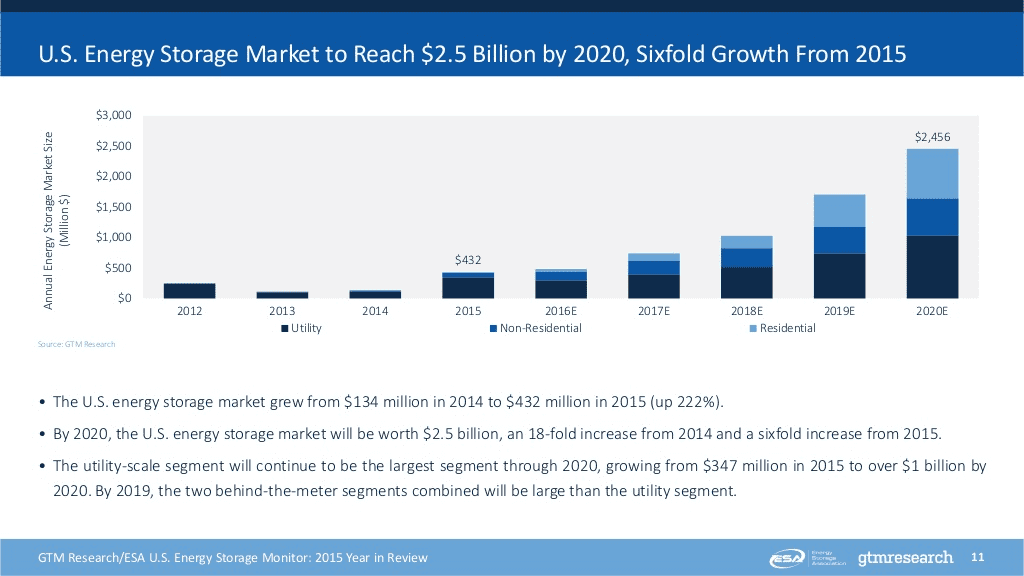 (Source: GTM) Energy Storage Investment by Sector: 2014 to 2024 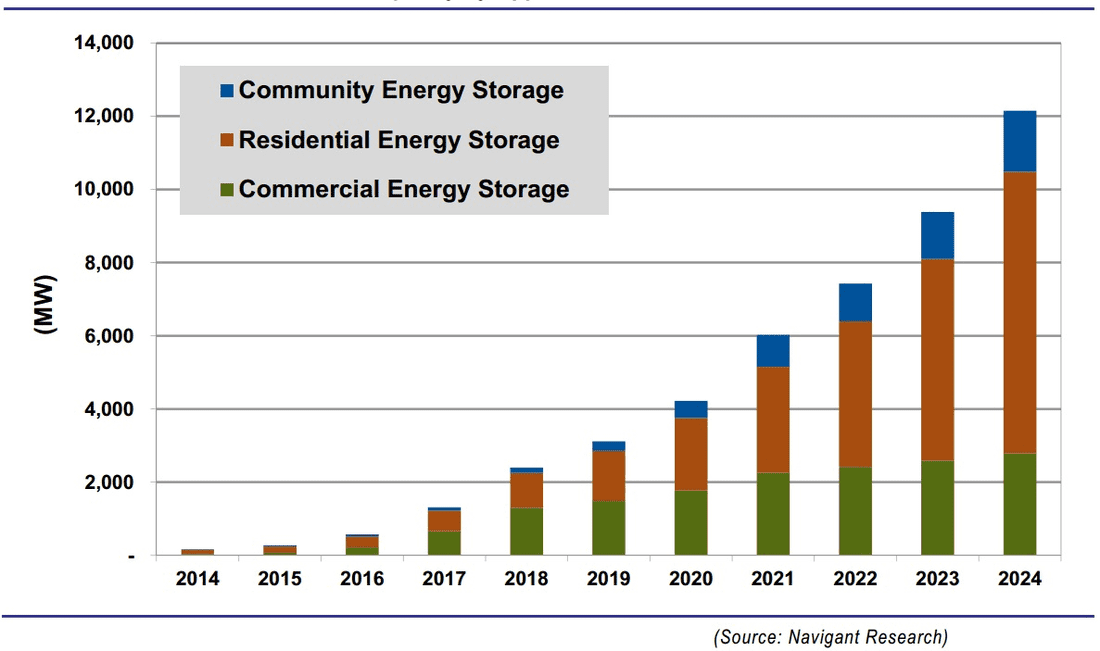 (Source: Navigant) Lastly, consider how energy storage investment opportunities vary based on the type of service provided at the utility level (graph below). The type of service most needed will also vary by state and utility, and drivers will be tied to policy, unregulated versus regulated market structures, degree of deferred grid investment, and a host of other factors. Navigant projects that revenue from this sub-market will exceed $15B by 2024. Energy Storage Capacity by Grid Service: 2014 to 2024 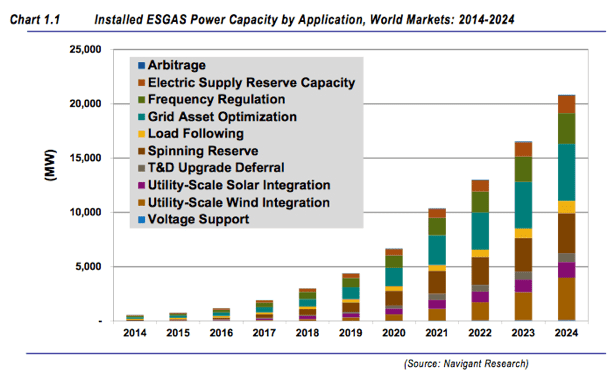 (Source: Navigant)
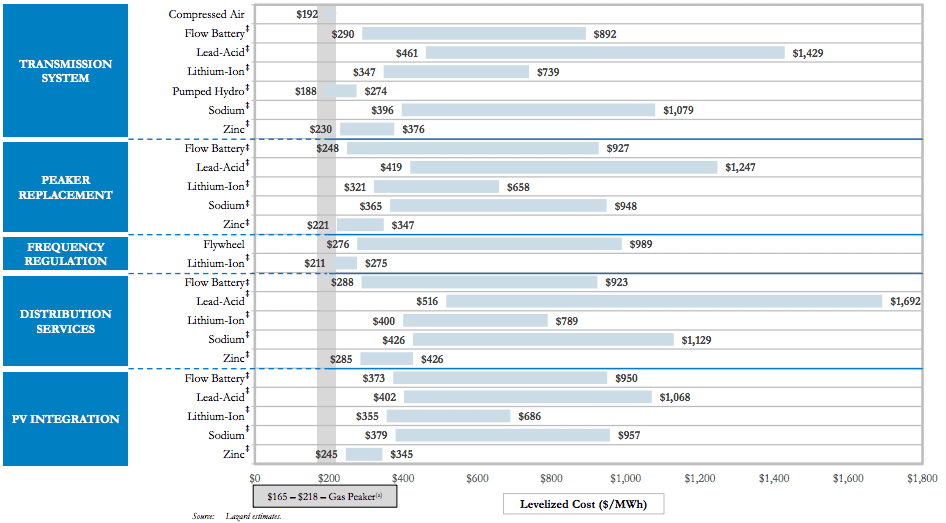 (Source: Lazard)
Related data points:
Energy storage must blaze new trails in bundled service business models in order to succeed In many ways, the economics of storage bears little resemblance to the economics of solar. Solar has undergone a remarkable jump up the technology learning curve, resulting in cost reductions that few predicted a decade ago. Solar electricity generation has characteristics that make it difficult to make a pure comparison with conventional generation. However, solar costs can be framed in terms very familiar to the energy industry: levelized cost of electricity (LCOE), power purchase agreement (PPA) rates, installation costs per watt, etc. Looking through this lens, we could see when and where solar approached grid parity, or the point at which there is no discernable cost difference between solar and incumbent technologies. The solar story was easy to tell - the technology could be relatively easily integrated into the current grid system, and the business models underpinning solar were eventually easy enough to grasp for consumers and the financial industry. This all drove the virtuous cycles of deployment, learning, and improvement that has placed solar squarely as the electricity source of choice for the future. The storage story, in contrast, is much more nuanced. Of course, at a high level, we can paint a similar picture as that of solar. We draw upon studies like Lazard’s, which provides some nifty levelized cost of storage (LCOS) comparisons for storage technologies across different applications (there is contention that levelized cost methodologies undervalue storage). Essentially all storage technologies in any application are outcompeted by natural gas peaker plants on a purely $/MWh basis. Two notable exceptions are with pumped hydro in the transmission system and lithium ion batteries for frequency regulation. Despite the fervor around battery technologies, it should be pointed out that the tried and true pumped storage technology is still, by far, the dominant storage technology in operation, comprising over 90% of installed capacity worldwide. But without some dramatic reductions in levelized costs for battery technologies, we are unlikely to see widespread adoption of storage technologies. Or will we? This is where the nuance in the storage story comes in. On the one hand, the cost of battery storage is projected to follow a similar downward trajectory as solar. Projections abound claiming anywhere from 25% to 70% cost reductions over the next 5-15 years. What is not to like? To put it simply - unmonetized value. On the other hand, there are a multiplicity of services that storage provides to customers, utilities, and grid operators (13 according to the Rocky Mountain Institute) for which there are no proven compensation schemes. For storage to break into the market in a meaningful way, it will need to move into bundled service business models. Getting beyond using energy storage for just demand charge reduction, backup power, or increasing solar self-consumption (which often only utilizes the storage system for a fraction of its lifetime capacity) to a stacked service model that also provides, for instance, frequency regulation, resource adequacy, or energy arbitrage services to the grid would open an incredible array of opportunities in which storage does not currently make economic sense. This is, however, no simple task. It will require time, experimentation, failures, and ultimately some successes to arrive on a spectrum of business models that can help unlock the vast potential of energy storage. The economics of storage works in certain niches, but the market needs stronger signals It is not altogether unfair to see some of the hype around storage as hyperbole. The technological optimists among us see a technology on the brink of unlocking a world of potential in the energy sector, and for more than just variable generation renewables. The skeptics might see the storage story through a somewhat different lens. Energy storage is not monolithic, comprised of a narrow range of market tested technologies that work at commercial scales. Rather, there is a staggering array of technologies, many in the R&D and demonstration phases, all competing to gain some traction in commercial markets. Picking the winners and losers out of this maelstrom is a tall task. And yet, VC investment in energy storage startups has fluctuated dramatically since its peak of $876M across 59 investments in 2011, according to CB Insights. There is clearly some concern about technology risk and market timing, given the sprawling field of energy storage technologies in development. However, the energy storage policy landscape leaves much to be desired. Grid policies have been slow to react to the growing promise of storage. Legacy net metering policies, while beneficial for generation technologies such as solar, are not well-suited for storage technologies that require the accounting for two-way energy flow. Ahead of many policy changes at the grid level, we can only hope to see more mandates such as California’s (1,325 MW of storage by 2020), which can clarify the way in which regulatory and grid policy must adapt. Without this high-level market signal, rate structures and other market restrictions may place a low ceiling on near-term energy storage deployment, especially grid-connected storage. In the meantime, behind-the-meter storage may be the best place to look for scaling up deployment, as customer-sited storage allows the users to capture the benefits of self-consumption, backup power, demand charge reduction, and time-of-use bill management, among others. Interestingly, behind-the-meter storage applications are rarely the least cost option, but offer a compelling return-on-investment proposition for enterprising customers. Yet, even these investments are leaving a lot of money on the table under current regulatory models and grid restrictions that prohibit behind-the-meter storage from providing grid services. Let’s hope that antiquated policy and market structures stymie the rapid progress needed in the energy storage market. Further reading:
|
sign up for ironoak's NewsletterSent about twice per month, these 3-minute digests include bullets on:
Renewable energy | Cleantech & mobility | Finance & entrepreneurship | Attempts at humor (what?) author
Photo by Patrick Fore on Unsplash
|
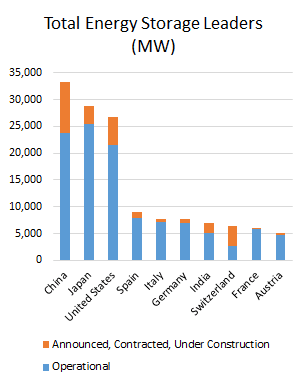
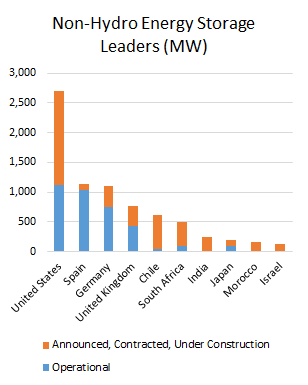

© 2009-2022 IronOak Energy Capital, LLC | (888) 249-3013