
|
1. Growth in solar is pushing costs down the virtuous path of technological learning If you consume any media or analysis on the solar market, you have undoubtedly seen many graphs like the one below. That sweet exponential curve has driven much shift in investor attitudes about and activity in solar. It is likely a relief that you are no longer a pariah when you bring up solar at investor conferences. Solar has been one of the fastest growing sources of electricity (along with wind and natural gas) since 2010. 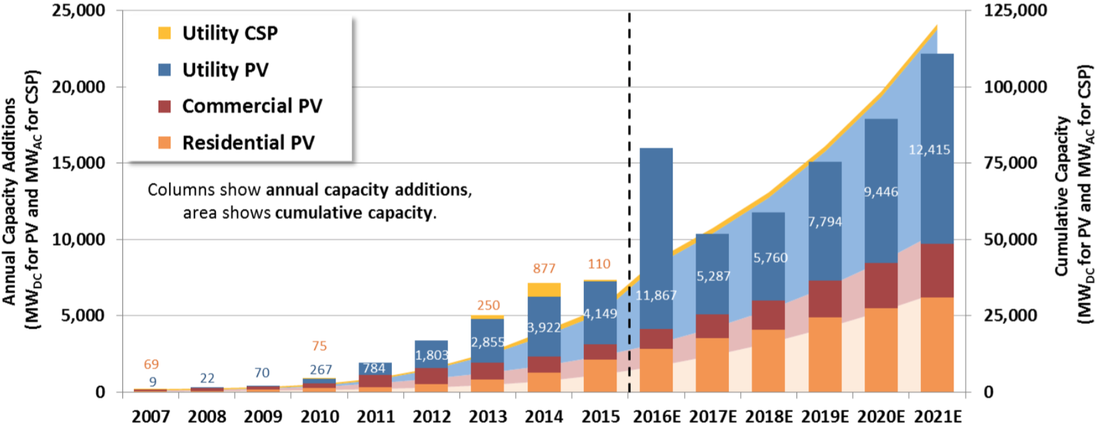 (Source: GTM / SEIA Solar Market Insight Reports, LBNL Database) But the real beauty in the growth of the solar market has to do with technological learning, or the predictable cost decreases that result from increasing “experience” with the technology. Most technologies exhibit the pattern displayed below. Growth in the development (or usage) of a technology unlocks a hidden treasure trove of reductions in cost, which further fuels the positive feedback loop generating more development growth. And so the march goes on. The graph below shows the reduction in the price of solar electricity, which is one measure of cost. We are going to dive into some others. The brain tickler is what the rate of cost reductions will be moving into the future. Even though solar has experienced an unexpectedly rapid reduction in costs, many predict this trend will not abate for some time. 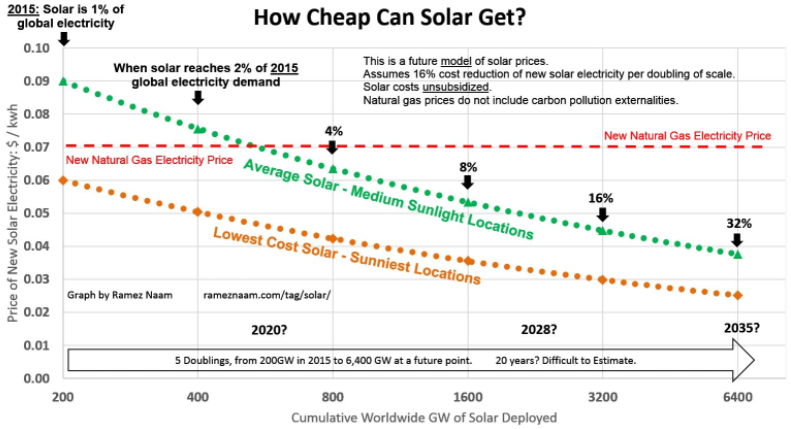 (Source: Ramez Naam) 2. Just because solar build costs are cheapest in utility-scale does not mean that is where the best risk-adjusted returns are The undiscerning investor may jump to conclusions - utility-scale solar must be the best bang for the buck because it is the cheapest. But you would be only partially right (and sometimes mostly wrong). While utility-scale solar is now consistently being installed for less than $2.00/W, this is the market where we are seeing the lowest per kWh revenues, as utilities are getting a bit less generous with their PPA terms (more on that later). But the projects are big and relatively standardized, so the investment profile is still attractive to many investors. Commercial (here referred to as non-residential) solar is a tantalizing market in that it can present an attractive investment profile, but often with some funky (e.g., heterogeneous) risk characteristics. You can find some appealing portfolios of projects above the 500 kW threshold, but there are a whole suite of idiosyncratic risks associated with the offtaker, EPC, etc. Only the brave (and smart) are wading into vast expanse of untapped opportunity in commercial solar, and with some considerable success. Watch out for the leading actors in the space. 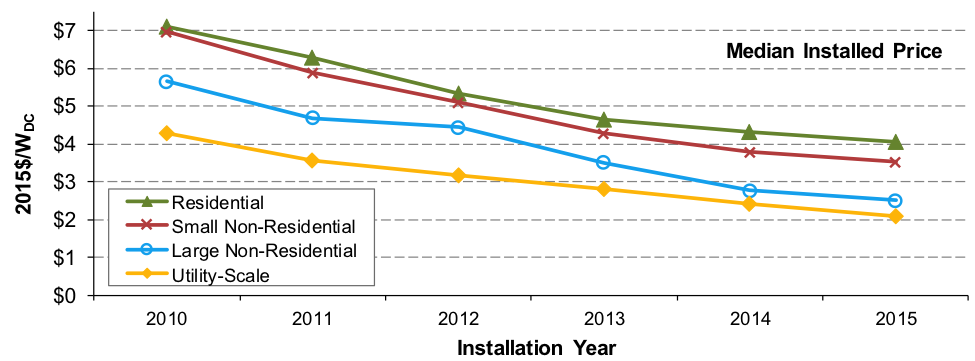 (Source: Scientific American) 3. Averages are useless - smart investors think in terms of distributions It is all too easy to think of solar as a monolithic industry, but that would be missing the story beneath the headlines. Distributions are the key to understanding market trends, and identifying areas ripe with opportunity. The graph below tells a story of market convergence. Most projects are achieving similar build cost performance over time. If you are presented with a project with all-in build costs above $3.00/W, then you either have a particularly challenging project, or a particularly challenged builder. Pick your poison. This convergence also means there is more a general sense of how to benchmark a project, and hold EPCs accountable to the standards being set by their peers. 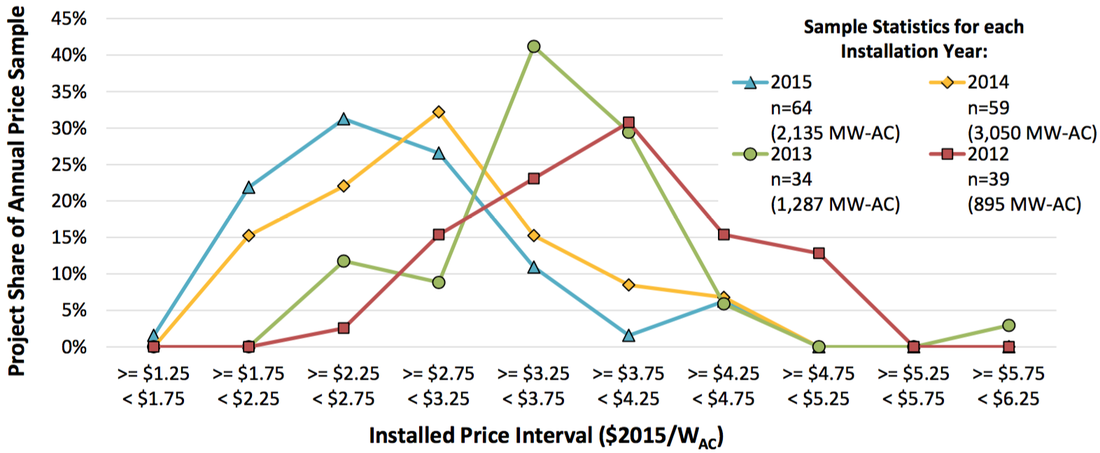 (Source: LBNL) Disclaimer: the sunniest places are not necessarily the best markets for solar. That largely is a policy driven issue, which will be a topic of another post. But sun (or insolation if you want to sound clever) can be very useful. The real takeaway from understanding geographic distributions is that capacity factors (e.g., the underlying technology performance of generating electricity) places some bookends around what sort of revenues and costs a project can support to hit your hurdle rates. The Northeast needs a bunch of incentives to have projects pencil for investors. Less so the case in sunny California or the Southwest. Developers are often inclined to slightly (or aggressively) inflate the performance of their projects. This is an easy area to push back if you have the right data at your fingertips. Remember solar negotiations 101: Don’t take the developer’s project valuation at face value. 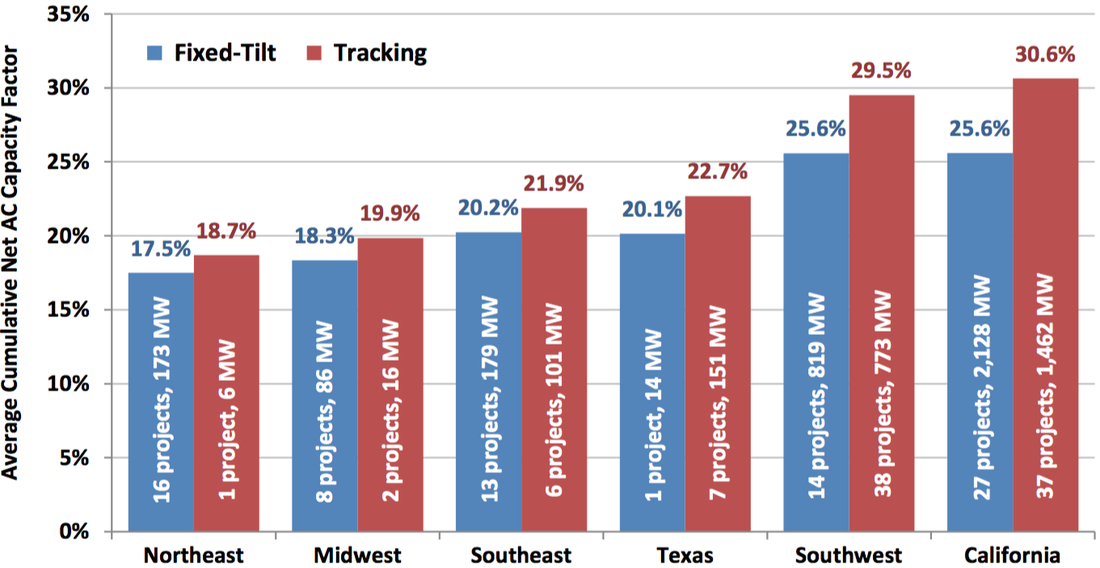 (Source: LBNL) 4. Return compression and the southern PPA migration It is often headline news when a new record low PPA rate is achieved. This is great for offtakers and utilities, but can be a source of deep consternation for investors seeking market rate returns. What is the enterprising investor to do? Utility-scale PPAs are now consistently below the $50-$60/MWh threshold, which is remarkable considering that just a decade ago, PPAs were 5x those rates. But this means that an investor that wants to compete in this market needs deep pockets and a low cost of capital. If when you look in the mirror, that is not you, then it is time for a gut check. Translation - you need to take some perceived (?) market risk. If you want to wade into a different area of the PPA pool, that means tapping to the aforementioned commercial (often referred to as C&I) market, or exploring more nascent markets such as community solar. You may be able to attract better PPAs, but they will be offset by higher per Watt build costs, O&M costs, and a different risk profile. This means a different underwriting and due diligence process that can cascade into high transaction costs for the unprepared. Choose your battles. 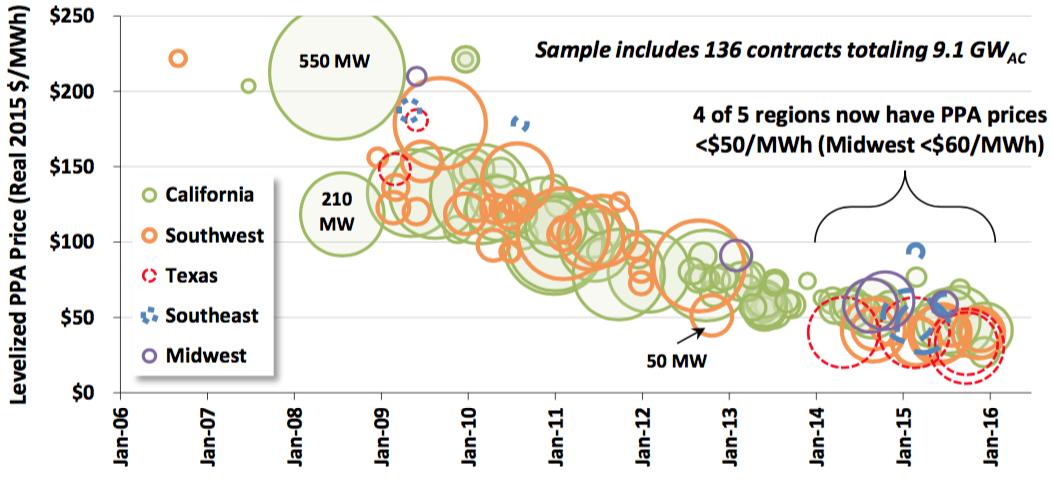 (Source: LBNL) 5. Don’t forget that solar projects are long-term operating assets. Investors should be riding the downward trend in OpEx to boost returns, especially on the back-end. One unmitigated piece of good news for investors is that O&M costs are also trending downward, now below $15/kW-yr. These often underappreciated components of any project cost profile are a key to unlocking longer-term value. Many investors often neglect to put the time and effort needed to manage OpEx costs to optimize returns, especially on the back-end of an asset’s lifespan. If you pay more attention in structuring asset management, O&M, insurance, and other OpEx contracts, the ROI will be, let’s just say, highly justified. O&M Costs 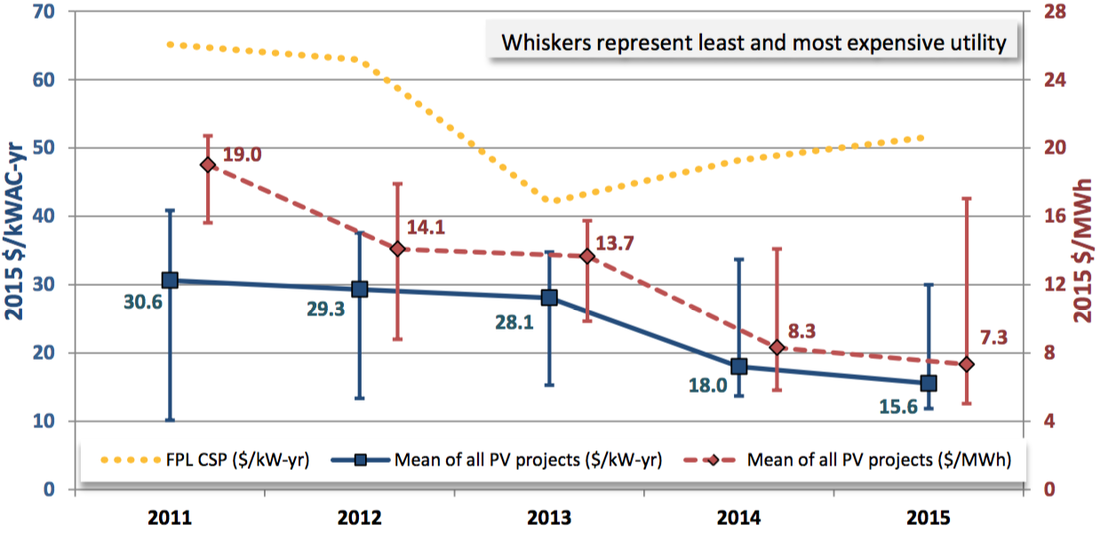 (Source: LBNL)
Comments are closed.
|
sign up for ironoak's NewsletterSent about twice per month, these 3-minute digests include bullets on:
Renewable energy | Cleantech & mobility | Finance & entrepreneurship | Attempts at humor (what?) author
Photo by Patrick Fore on Unsplash
|

© 2009-2022 IronOak Energy Capital, LLC | (888) 249-3013