|
The post-mortem reports are coming in droves as SunEdison prepares to file for bankruptcy. There are many diagnoses of the fall of this giant, but the common thread running through all of them is that SunEdison wanted to become the preeminent market force in the solar industry, but lacked the patience to build to that stature without burdening the company with excessive risk. And that risk, largely in the form of over-leverage, has come back to bite them in a big way.
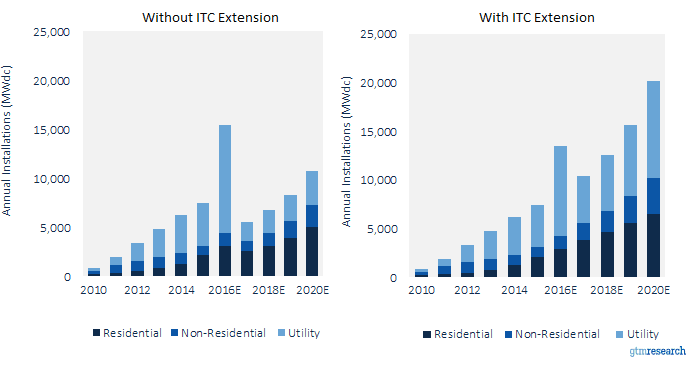
Until the last year or so, it seemed as though SunEdison was the most prescient player in the market. They took advantage of historically low interest rates to use leverage to build and acquire solar assets at an unprecedented pace. Of course, revenue growth could not keep up with the accumulation of what became nearly $12B of debt by 2015. It was a classic market share play gone awry. By the time they committed to this path, the solar industry was likely not large enough to accommodate the growth expectations baked into their corporate strategy. They had to start acquiring anything and everything, often through massive overbidding for projects, which further cut into their increasingly small margin for error. As a result, they have been hemorrhaging EBITDA since 2012. But, hey, Amazon did the same thing for years. The only difference is that this model does not work in infrastructure companies dealing in hard assets. Growth at all costs is not a sustainable strategy When you start on the growth hamster wheel, it is hard to find an opportune moment to get off. In order to maintain the illusion that SunEdison was still a financially sound company with healthy growth prospects, it had to double down time and again on their acquisition strategy, ultimately culminating in the failed attempt to acquire Vivint. That marriage was always going to be an awkward one, but it still lent SunEdison the air of being the most ambitious behemoth in the market, and maybe adding Vivint to the increasingly diverse cauldron of business lines could conjure something greater than the sum of its parts. But the convoluted amalgam of yieldcos and mergers only widened the breach in the hull. This has all come to a head with the proliferation of recent news that suggests that SunEdison has long been in internal panic mode. The Vivint deal was never consummated, and a nasty lawsuit is on the horizon. The relationships with Terraform Power and Terraform Global are as tenuous as ever, various executives have left (of their own volition or not, who is to say), and there are a number of investigations into the accounting and financial reporting practices at the company. SunEdison’s debacle is an anomaly, but still serves as a cautionary tale There is no telling how the bankruptcy proceedings will play out, but it is certainly going to entail a massive sell-off of SunEdison’s assets to pay off creditors. This has already started in India, where they recently announced 450 MW of projects for sale. Whether SunEdison can emerge from the wreckage with anything intact is anyone’s guess. And whether there was actual merit in their growth strategy is also a point of contention. You can add SunEdison to the Abengoa’s of the recent past—cautionary tales in how growing too big, too fast, and with too sprawling and risky of a corporate strategy can lead to truly fantastic collapses. The naysayers may point to SunEdison as evidence of some underlying weakness in the value proposition of solar for large developers and investors. But when you look closely at the autopsy, you can see clear signs that this giant was destined to fall under the weight of over-leverage, rapid expansion into risky markets, suspect acquisitions, and perhaps a bit of hubris from management. In the backdrop of the sensational demise of SunEdison, companies such as First Solar and SunPower have been excelling in the current market environment. In our previous monthly reports we have focused on state solar policies. Our research indicated a growing trend among state legislators and regulators to review, amend, and in several cases, phase out or even cancel solar incentives and long-standing, proven solar policies. Although this process could be viewed as a natural regulatory action in response to a market reaching maturity, it has nonetheless taken its toll on the solar market. After the Nevada Public Utility Commission’s controversial December 2015 decision to slash net energy metering, many residential solar installation companies halted operations in Nevada, with giants like SolarCity and Sunrun exiting the state. Similarly, Michigan’s legislature is considering a change to its solar policy that will reimburse generators at wholesale rather than retail rate, making the state’s thriving solar industry nervous. In February, Massachusetts reached its net metering and REC caps, halting operations of solar developers and installers in a state that has more solar jobs than any other state except California. And North Carolina’s lucrative solar tax credit is set to expire at the end of this year, creating uncertainty and concern among local industry players in one of the nation's largest solar markets. Policy uncertainty is never a good thing. However, what many state-level regulators and legislators tend to forget is that keeping policies unchanged is not enough; to continue to grow, the solar industry needs certainty as much as it needs stability. In a constantly changing regulatory environment, threats are almost as much of a problem as actual changes. Initiatives to review or amend policies, increase rates, or decrease incentives make investors wary of new investments, thereby escalating the cost of raising capital. Thus, while DC legislators have contributed their share to the national effort to create certainty and stability in the solar market, state legislators are failing to do their part. This is rather sad news for the solar industry that celebrated the ITC extension, but relies on states’ policies to continue driving investments in solar energy. Indeed, renewable portfolio standards account for more than 50% of investments in utility solar, and net energy metering is considered the main driving force behind residential rooftop solar. However, it is not all grim for the solar industry. Despite the uncertainties from state to state, the industry continues to grow. The quarterly SEIA/GTM Research U.S. Solar Market Insight report for Q4 2015, released in early March, predicts that the solar market will grow 119% in 2016. As in previous years, most of the projected added capacity is attributed to utility scale installations. But if many states are not providing the stable regulatory framework required for a healthy business environment, where is this substantial projected growth in utility scale solar coming from? Before Congress extended the ITC, the 30% tax benefit for solar installations was set to drop to 10% on January 1, 2017, and to expire in 2018. This tax cliff created an incentive to bring as many projects as possible online before the 2017 drop down, thus driving the unprecedented expected growth in 2016. Utility scale installations require long planning and development, so although the ITC was extended last year, it was too late for players to react to the new tax environment. This is why installations in 2017 are expected to fall significantly, while commercial and residential PV will be less affected. The effect of the ITC extension on the different solar sectors can be seen in the graph below. U.S. PV Installations With and Without ITC Extension, 2010-2020 (Source: GTM Research) Moreover, there is another federal framework that drives investments in utility scale solar. Unbeknownst to many, the federal Public Utility Regulatory Policies Act of 1978 (PURPA) is gradually emerging as a useful tool for utility scale developers in a post-RPS world. Enacted in response to the 1973 energy crisis, PURPA imposes a mandatory obligation on utilities to purchase renewable energy from “Qualified Facilities” (QF) at the utility’s avoided cost. To meet the requirements for a QF, an energy-generating facility must not exceed 80 MW and its primary energy source must be biomass, waste, geothermal, or renewable resources. With prices per megawatt-hour in the $40 to $60 range, utility solar is at cost parity with natural gas, making it a strong competitor in PURPA’s avoided cost markets. In 2015 over 500 MW of PURPA-driven projects came online in North Carolina, and states like Texas, South Carolina, Utah, Oregon, and Idaho are also leading the way in utilizing PURPA for utility scale solar. States With >50 MWdc Non-RPS Utility PV in Development (Source: GTM Research)
As a federally mandated purchase, PURPA solar projects are not subject to state solar caps. Moreover, FERC regulations define “avoided cost” as the incremental costs to an electric utility of electric energy, capacity, and environmental externalities fees which the utility will incur if not purchasing electricity from the QF. The broad definition of “avoided cost” allows more facilities to enjoy QF status. However, despite the seemingly positive outlook for PURPA’s potential for solar developers, one must remember that it is very hard to enforce a PPA on a utility that does not want to enter one. One way of deterring QF developers from engaging with uninterested utilities is to propose terms and conditions that are more onerous to the QF than to non-PURPA counterparties. While FERC has succeeded at curtailing such practices, bad faith negotiation tactics are hard to prove and only few developers are willing to pursue costly litigation in an effort to obtain a PPA with an obstinate utility. To reduce transaction costs and assist smaller developers in negotiating with utilities, certain states have adopted standard contract rates for QFs of up to 10 MW (California up to 20). The standard contract makes it nearly impossible for utilities to avoid purchasing electricity from QFs. It is therefore not surprising that utilities in leading solar PURPA states are requesting utility commissions to reduce standard rates contracts caps. Late in March, the Oregon PUC approved Pacific Power’s request to reduce the eligibility cap for solar generation at QFs to three from ten MW, and a similar motion by Duke Energy was rejected by the North Carolina PUC late last year. As the price for solar generation continues to drop, we are expecting to see more PURPA driven PPAs across the nation. Whether PURPA PPAs will provide the necessary certainty and stability the market is currently lacking depends on FERC’s willingness to enforce its rules on avoided cost mandatory purchases, and Public Utility Commissions’ ability to withstand utility pressure to reduce standard contracts rates caps. Energy storage offers too many behind-the-meter benefits to consumers and grid operators to not become a common, if not essential, part of commercial PV projects. The myriad benefits of energy storage validate the basis of a beloved food analogy: “Energy storage is the new bacon—it makes everything better.”
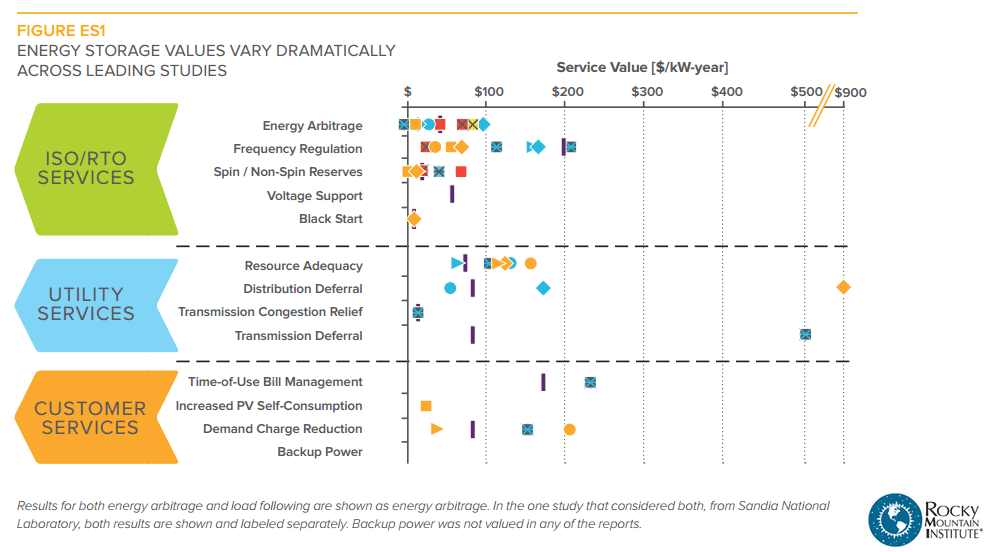
The consumer-centric benefits are the most widely discussed, and they usually focus on shaving peak demand by reducing costly demand charges for commercial customers. In addition to mitigating demand charges, solar plus storage allows end users to benefit from time-of-use bill management, backup power availability, and increased PV self-consumption. Moving up the food chain, utilities can use energy storage to achieve resource adequacy, transmission congestion relief, and transmission deferral. Finally, Independent System Operators, or ISOs, benefit greatly from energy storage predominantly by increasing frequency regulation, but also via voltage support and energy arbitrage. PJM’s Atlantic-coast-to-Illinois territory became the first ISO to provide monetary incentives ($40-$50 per MWh) for grid-scale storage that directly addresses frequency regulation. On a related note, let’s talk about those scary “death spirals.” The U.S. energy storage market will be 8 times bigger in 2020 than it was in 2015, reaching 1.6GW of installed storage capacity. By 2020, the utility death spiral will have fully taken hold and grid defection will be occurring all over the country, right? I think not. In 2014, I contributed to a Rocky Mountain Institute paper called The Economics of Grid Defection, which seemed to briefly serve as a crystal ball for the nascent energy storage industry. But no more than two years after the report was released, even a modest amount of grid defection seems highly unlikely given the proactive efforts by utilities nationwide to design pilot projects and sustainable policies that integrate solar plus storage with existing grid infrastructure. The energy storage market will begin to resemble more of a shared economy rather than an increasing number of grid-defected silos. The availability of storage devices, both directly from the ramped up manufacturing as well as second-hand batteries from electric vehicles, will provide a sustained supply of storage assets to expand grid storage capacity. These are both compelling sources of affordable storage assets, and certainly a reason to believe the repeated headlines regarding anticipated drops in energy storage costs. The solar plus storage revolution is being driven by cost effectiveness and scalability, two key drivers that provide a strong signal for future growth. Navigating murky waters: Accessing the ITC for solar + storage projects It’s inevitable that developers compare the benefits of energy storage to the well understood benefits of solar PV systems. The reality is that the technology for deploying and optimizing energy storage is much more complicated than solar, which impacts the bankability and clear financing strategies needed for exponential capacity growth. Prioritized revenue streams from solar plus storage projects include basic kWh production from PV, in addition to the benefits derived from stored, dispatchable electricity when rates are peaking to shave off much more demand charges than solar could have ever done on its own. Aside from contracted revenue from the end user, determining the ability for solar plus storage projects to qualify for the 30% ITC (Investment Tax Credit) is a critical factor for getting projects to hit desired investment return thresholds. Solar plus storage installations qualify for the 30% ITC, but developers need to pay close attention to system design to ensure that the intended cost basis appropriately applies to the ITC’s rules and regulations. A few key insights include:
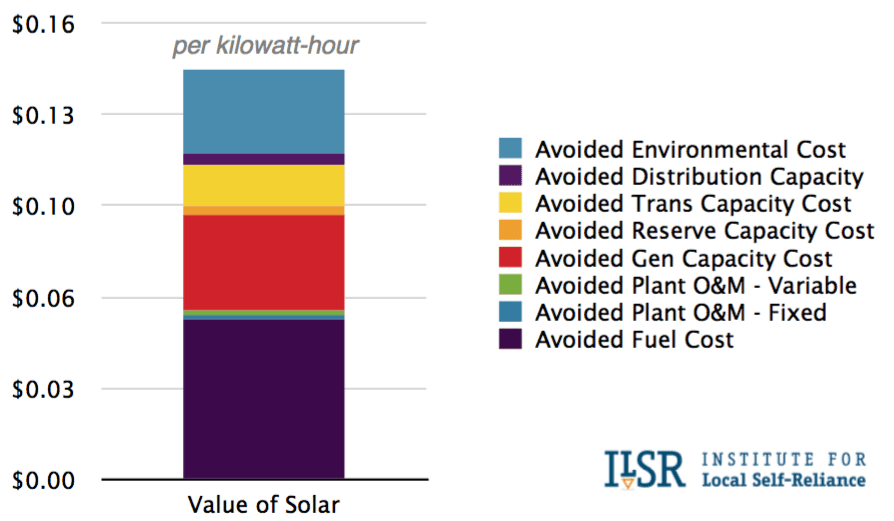
3/30/2016 What future Value of Solar policies could mean for the solar industry: 3 key things to knowRead Now There has been a wave of contentious net metering policy battles waged across the U.S. in 2016. Some net metering policies have remained largely intact, as in California, though much to the chagrin of the utilities. Other net metering policies, such as those in Nevada, have been fundamentally restructured, to put it kindly - though many would say they were just plain gutted. As with the ITC, a significant part of the solar industry formed around the net metering policy structure, and like many industries is reluctant to let go of such a foundational policy. But the aforementioned battles beg the question - is net metering the appropriate policy for solar looking to the future? Many believe that it has been a necessary stopgap policy measure, but not one that needs to live in perpetuity. One alternative that has been floated is the idea of a Value of Solar (VOS) policy that seeks to compensate solar based on a more nuanced understanding of the value that it provides to the grid. That is an easy enough idea to get behind, in theory, but just what could VOS mean for the industry? (Source: Institute for Local Self-Reliance)
Utilities and solar investors both come out on top with a VOS policy
Avoided costs hold the key to understanding how the “Value of Solar” is framed
Playing up the environmental costs angle could be the greatest strength of VOS
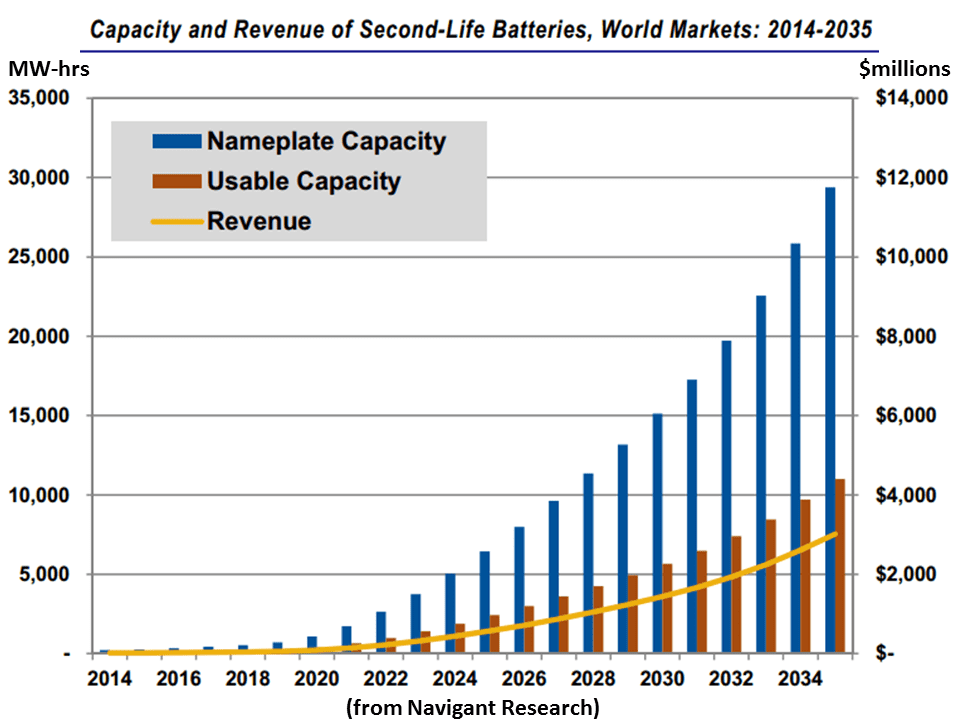
The City of Austin, TX and the State of Minnesota have led the charge on the initial VOS studies, and have proposed different cost structures and calculation methodologies. It would have been easy to anticipate that VOS would have taken off, especially as a substitute for the much-maligned net metering policies, but so far it has not. But if the recent solar policy battles are any indication, the days of the old net metering policies may be numbered. VOS may open the door for a more nuanced treatment of solar in our energy policy. For most EV businesses, the details of solar project development and operations are a related but distant world. Similarly, to solar developers and investors, the EV market is interesting, and most of them want to own a Tesla (including me), but integrating the two industries is a bit of a leap. However, some of us are wearing both hats. At IronOak, we simultaneously supply solar project investors and developers, as well as EV market makers, with research and transaction advisory services. In fact, at this moment, we are working on hundreds of MWs of solar projects and fleet roll outs totalling thousands of EVs in major U.S. cities. As one example, I serve as an Advisory Board member for Paul Allen’s Vulcan, Inc. in its innovative partnership with the U.S. Department of Transportation Smart City Challenge, which will award $50M to a single city to help electrify its transportation network. A report this month by the German Renewable Energy Federation highlights the massive potential link between the EV and solar markets. Estimates suggest that second-hand batteries from the world’s nearly 90 million EVs sold by 2030 could provide 1,000 GWhs of power in stationary uses such as integrating renewable power into grid, homes, and businesses. Apparently, when EV batteries get below about 80% of their original capacity, which occurs roughly 6-10 years after they’re first used, it’s time to replace them. Yet they might still have 10 years of life left. If true, this is important for two reasons:
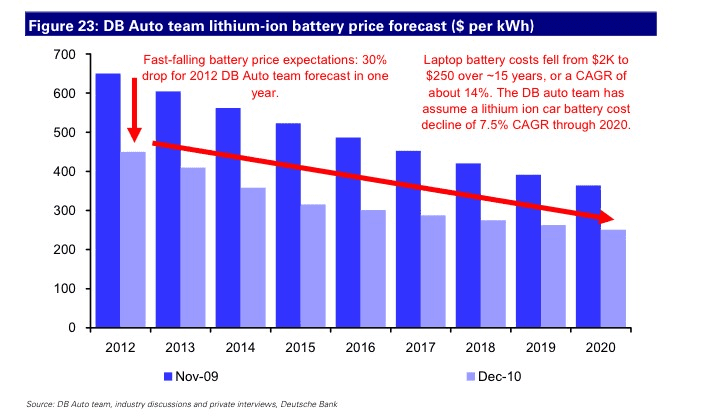
For a sense of the scale of this opportunity, as well as how fast the cost of storage is falling, consider the graphs below, based on Navigant and Deutsche Bank projections. Revenue risk: More than amount and number of sources, it’s about certainty No surprise, investors and banks like some predictability—less for the former and more for the latter—in the revenues and costs of the projects they own. The same logic applies to energy storage investments. However, with at least 70 different battery chemistries being tested or manufactured at some scale, many believe that technology risk is the main barrier for battery roll out. Yet lithium ion batteries accounted for 96% of (chemical) storage added to the U.S. grid last year. As such, it’s the ability to forecast revenue, not remove technology uncertainty, that is the key to growing this nascent market. Scanning the figure from RMI below, it is clear that batteries provide many services at the transmission, distribution, and DG scales. One would assume that each of these would also create revenue for energy storage project owners. But you know what they say about assuming, right? The Urban Dictionary tells me that certain body parts are involved in the saying. While the amount of potential revenue from multiple sources is appealing, it is not often possible in project structures. But it can happen. As an example, we have originated and are helping to underwrite a $100M-plus energy storage portfolio for a large international investor right now, and this projects makes financial sense because it is “stacking” several sources of revenue, and creating contractual certainty for some of these sources.
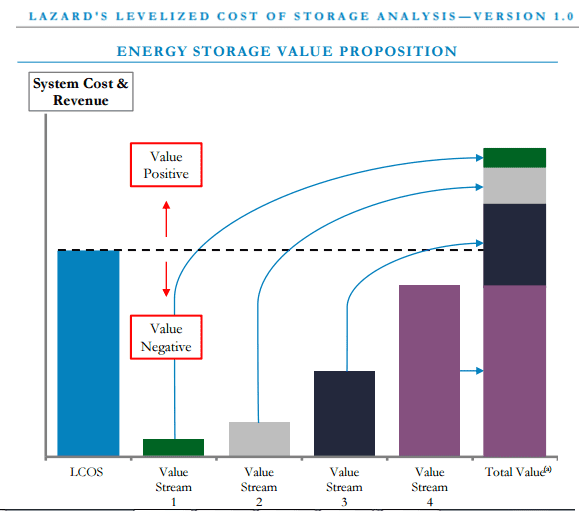
To further illustrate this potential stacking of revenue, consider the November 2015 levelized cost of storage analysis by Lazard (below). They rightfully stress that their study does not look at revenue stacking, but this is exactly what is required to make more battery projects financially feasible. However, as I learned from talking to a public utility commissioner recently, utility regulations to allow more of these battery services to be monetized are not making it onto the radar of utility commissions because the market is still so small. Alas, we have a chicken and an egg... The U.S. DOE’s Energy Storage Database is a powerful tool available to assess the current state of the global energy storage market. Built by Sandia National Laboratory, under an ongoing contract with Strategen Consulting, the database allows for searching and filtering across both storage policies and projects, in the United States and globally. Here we take a closer look at what the data can show us about the energy storage project pipeline. “Energy storage” encompasses a wide array of technologies, applications, and public policy inducementsFor policy analysis, the user is able to sort and filter according to the following criteria:
Four major energy storage technology families can be distinguished, including:
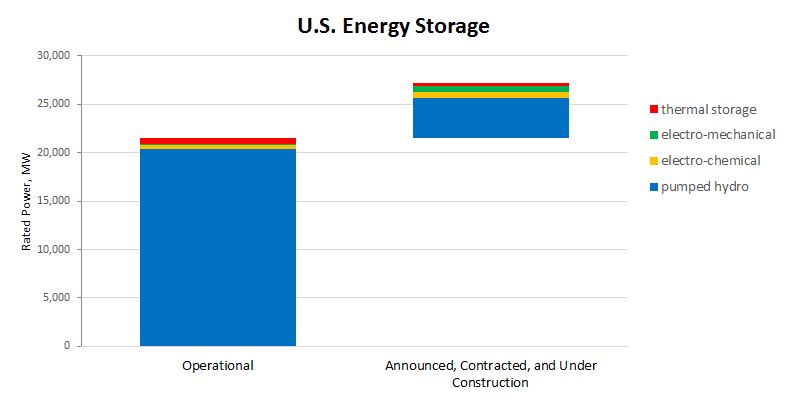
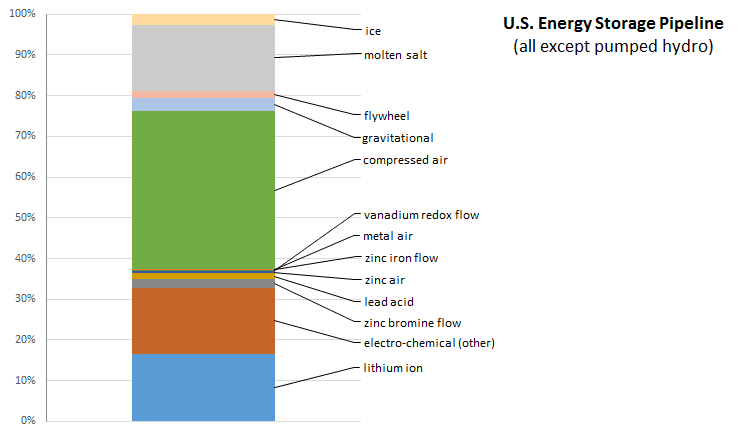
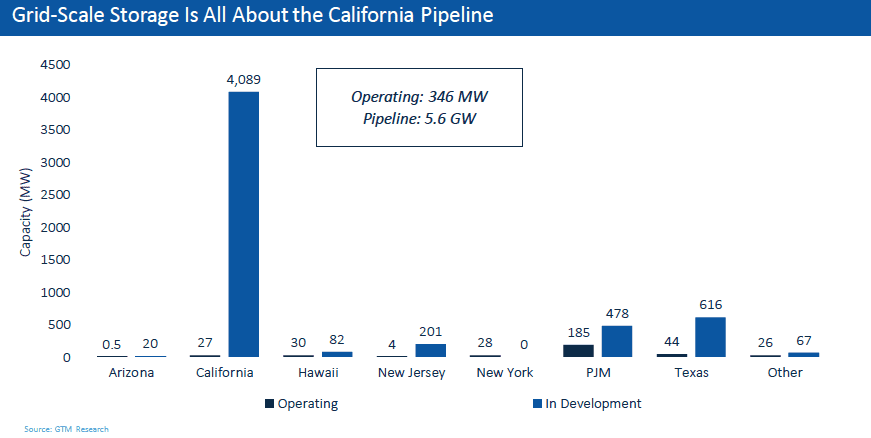
The U.S. energy storage pipeline: Pumped hydro still dominates, but its position is weakening The total rated power capacity of currently operating U.S. energy storage comes to 21,484 MW. (Over the years, 15,584 MW has been decommissioned, and 7,684 MW is currently offline or under repair). This U.S. capacity will grow by 5,760 MW in additional energy storage capacity, going by those projects that have been announced, are contracted, or are under construction. (Source: DOE Energy Storage Database, data downloaded 3/20/16) We see that pumped hydropower storage remains the giant in the field, with a pipeline of 4,150 MW of rated power to add to existing operations of 20,356 MW. However, among the technologies, it is growing the slowest, adding only 20% of capacity. Thermal storage is expected to add 302 MW of rated power to the existing 553 MW (an increase of 54%). Electro-chemical approaches will add 602 MW, a rise of 148% over the existing 405 MW of rated power capacity. The most dramatic pipeline growth, relative to existing capacity, is with the electro-mechanical technologies such as compressed air storage and flywheels, a finding that runs counter to prevailing assumptions in the market. An additional 706 MW of power capacity is expected to come on line in this area, an increase of 418% over the present capacity of 169 MW. (Source: DOE Energy Storage Database, data downloaded 3/20/16) At the top of this chart we see the thermal projects that have been announced, contracted or are under construction. Next are the clusters for electro-mechanical and battery technologies. No projects are listed for sodium-based or zinc manganese dioxide batteries, or for electric capacitors. What is the takeaway message for investors? Future tendencies may not all be about batteries, and one would be wise to consider all available energy storage applications, depending on the project needs. Finally, where in the United States are most of these projects headed? According to research by CleanTechnica, California is leading the way, likely due to the recent state-level energy storage mandate. Related data points:
States with > 50 MW Non-RPS Utility PV in Development (Source: GreenTech Media)
Related data points:
Conventional wisdom says that the solar market is policy-driven, but this is changing in a big way The most vibrant and active solar markets are driven by Renewable Portfolio Standard (RPS) programs with supporting net metering and feed-in-tariff (FIT) programs, or so goes the conventional wisdom. California and Massachusetts exemplify this supposition, as their RPS programs undergird two of the largest utility-scale solar markets in the U.S. But evidence is mounting that the solar market will no longer be driven exclusively by RPS mechanisms. In 2015, 39% of utility-scale solar was procured using non-RPS mechanisms, and this is projected to increase to 52% in 2016. This begs the question - what is driving this marked shift? Falling costs are making solar more competitive with conventional generation The fact that solar has been undergoing rapid cost reductions is a borderline platitude at this point (see here for a good summary of key facts). Estimates for the average installed cost of utility-scale solar in the U.S. was $1.45/watt in 2015, with more reductions projected in the coming years. However, the real interesting question is how these cost reductions are changing the dynamics of competition across energy sources for utilities. Grid parity is considered the holy grail for utility-scale solar, and grid parity (or better) with prevailing natural gas prices has become a reality in many U.S. states (see here for some more detail on grid parity). This change in the market is making it real easy for utilities to make the simple economic argument that signing 20-year PPAs at below $60/MWh is not only the most prudent course of action from a bottom-line perspective, but also the best hedging strategy, which is discussed further below. This has also given rise to a new wave of avoided-cost contracts in states where solar is cheaper than conventional alternatives. This was enabled by PURPA (Public Utility Regulatory Policy Act), a landmark energy law from the 1970s that mandates that utilities purchase electricity from independent power producers (IPPs) if their cost is below the marginal cost of increasing the utility’s generation capacity through conventional means. This type of arrangement greatly reduces the risk of developing solar projects of a certain size, and has fueled the markets in states such as North Carolina. There is another big story behind the rise of non-RPS utility-scale solar related to the role of corporate PPAs, which you can dig into in a previous blog. The hedge against variable (and volatile) natural gas and coal fuel costs is attractive Many utilities are starting to see the writing on the wall in terms of their exposure to variable and volatile fossil fuel prices. Do not believe the hyperbole that oil and gas prices have reached a “new normal” with prices hitting lows not seen for many years (see a good discussion of peak oil here). We are likely amid an anomalous period of low petroleum prices brought on by a confluence of factors - namely, historically high oil prices prior to the 2008 recession which escalated investment in exploration, and cheap financing made available through low interest rates. The current oil and gas low prices are undercutting the ability of firms to invest in exploration, which will eventually erode the current surplus and lead to future deficits and much higher prices than we see today. As discussed in a previous blog, even the most conservative projections of future natural gas prices has them increasing, with many projections substantially above current prices. The future of coal is a more complicated matter, but suffice it to say that any utility which maintains coal as a primary long-term energy procurement strategy will be taking on a great deal of policy and financial risk. When seen from this perspective, any rational observer of the U.S. utility sector would naturally conclude that they need to invest heavily in hedge strategies to protect against the inevitability of volatile and unpredictable fossil fuel prices. As many utilities have gained exposure to and comfort with solar PPAs as a compliance mechanism to meet RPS targets, it started to dawn on them that there could be substantial benefits to using PPAs as a hedging strategy. As a consequence, we are now witnessing a boom of procurement taking place outside of the RPS-driven solar markets, at least partially driven by the desire to increase their portfolio of low-risk electricity generation from solar PPAs with predictable rates for 10-25 years. It seems somehow fitting that utilities are increasingly more willing to exchange their variable-priced fossil fuel capacity for variable-generation solar capacity. Further reading:
C&I solar market starting to attract some attention from investors
Commercial and industrial (C&I) solar has, to a certain degree, fallen between the cracks in the landscape of solar financing. Utility-scale solar, given its high capital requirements and relatively straightforward risk profile, has been an easy sell for debt providers, tax equity investors, and well-capitalized equity investors. Small-scale rooftop solar has found success in third-party financing and leasing models that have unlocked a wave of deployment, especially in states with favorable net metering policies. Compared to these two markets, C&I has been a more difficult market to serve. The smaller scale of the projects is often unattractive to many investors, and can create a bottleneck when it comes to finding tax equity investors. Moreover, the higher transactions costs and more opaque risk profile compared to utility-scale solar have handicapped this sector in the eyes of many underwriters and investors. The challenges faced by the C&I market are not evidence of any underlying weakness in the value proposition, but rather that different approaches are needed to serve this highly untapped market space. Increasingly, investors are recognizing this need, and entering the C&I market with the intent to reduce transaction costs, standardize the due diligence and underwriting process, and bundle projects to achieve the scale necessary to access more efficient capital markets. There are excellent prospects of higher risk-adjusted returns and comparatively less competition for those successful in mitigating the risks inherent to the C&I market. Lucrative opportunities increasingly concentrated in states with healthy SREC markets As solar deployment has accelerated and installation costs continue their downward trend, it would be reasonable to conclude that there should be no shortage of lucrative solar project investment opportunities. But then, you would be overlooking the countervailing impact of progressively lower and shorter term PPAs, particularly in markets dominated by a small number of incumbent utilities with concentrated negotiating power to determine the terms. PPA rates are now consistently falling below the $60/MWh threshold, sometimes with no escalators, and for periods as short as 10 years. Returns to solar project investors are being squeezed to the point where traditional investors in the space may be starting to look elsewhere to meet their hurdle rates. Solar project investment activity is increasingly focusing on the handful of states with healthy SREC markets. Massachusetts and New Jersey are the most prominent in the mix. Massachusetts SREC I bid prices are trading above $450/MWh and SREC II bid prices are around $270/MWh, though these markets are on hold due to pending legislation. New Jersey SREC bid prices are all hovering around $280/MWh. Washington D.C. and Maryland both have SREC programs with bid prices above $100/MWh, which rounds out the most impactful programs from a price standpoint. These additional revenue streams can help to offset the lower PPA rates, and increase risk-adjusted returns to a level that is attractive to many investors. You may ask - what is driving these SREC bid prices? To which I would respond - the oldest economic story in the book is playing out in these markets The supply of solar (solar project installations) and the demand for solar (driven largely by RPS and solar carve-out policies) govern SREC prices. The extension of the solar ITC is projected to increase the solar pipeline over the next five years, thereby increasing the supply. On the other hand, there is concern about dwindling demand for SRECs, as program caps and other RPS targets are met. Already in Massachusetts, we are seeing developers faced with increased risks due to caps being hit for the SREC II program. When you combine the increasing supply with decreasing demand, you quickly get the picture that SREC prices may not be able to exist at their current levels for many years to come. This eventuality has motivated solar developers and investors to quickly take advantage of the current market conditions in these target markets. |
Details
sign up for ironoak's NewsletterSent about twice per month, these 3-minute digests include bullets on:
Renewable energy | Cleantech & mobility | Finance & entrepreneurship | Attempts at humor (what?) author
Photo by Patrick Fore on Unsplash
|

