
|
The latest U.S. Solar Market Insight Report from GTM Research and the Solar Energy Industries Association reveals that the U.S. installed a record 7.3 GW of PV capacity in 2015, with solar installations surpassing natural gas capacity additions. Overall, solar accounted for 29.5% of all new energy capacity additions in the U.S. in 2015. U.S. Solar PV Installations, 2000-2015 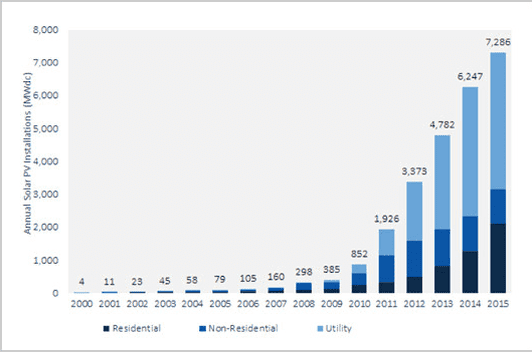 (Source: GTM Research / SEIA U.S. Solar Market Insight Report) Among the different solar sectors in the U.S., residential PV has been the fastest-growing market segment, expanding by at least 50% over the past three years and 66% in 2015. By Q1 2016, the number of U.S. homeowners with rooftop solar is expected to cross the 1 million mark. Indeed, the falling costs of installation paired with rising retail electricity rates make residential solar economics increasingly attractive in a growing number of states. A GTM study released in February found that 20 U.S. states have reached grid parity for residential solar. However, the increase in rooftop solar installations and the accompanying rise of net energy metering policies have revealed several issues underlying high penetrations of solar, among them:
In response to these concerns, and especially the concern among utilities that a decline in sales will generate insufficient revenue to cover the fixed costs of maintaining the grid, some utilities have suggested imposing higher fixed charges on their customers as a method to recoup costs. In 2015 alone, 61 utilities in 30 states requested public utility commissions to increase fixed charges, making it the most frequent policy proposal impacting distributed solar in the last year. 21 utilities in 13 states proposed adding new or increasing existing charges specific to residential solar customers, with the median requested increase at $5 per month. While seemingly a “quick fix” for utilities’ declining revenue concerns, fixed charges do not vary with usage and cannot be avoided with energy net metering credits. Thus, higher fixed charges significantly reduce the financial value of installing solar PV systems. Moreover, fixed charges harm low income and low usage customers and they fail to provide accurate price signals to customers, thereby reducing customer incentives to save on energy use. Research institutes, think tanks, and regulatory agencies have suggested other approaches to address concerns associated with net energy metering in high solar penetration states, among them: time-of-use pricing, smart metering, locational marginal pricing, minimum bills, and revenue decoupling. These suggestions are currently being weighed by legislators and public utility commissions in at least 27 states. Unfortunately, rate review processes are lengthy, and in the meantime the solar industry is paying the price for policy uncertainty. After the Nevada Public Utility Commission’s controversial December 2015 decision to slash net energy metering, many residential solar installation companies halted operations in Nevada, with giants like SolarCity and Sunrun exiting the state. This month, Massachusetts reached its net metering and REC caps, halting operations of solar developers and installers in a state that has more solar jobs than any other state except California. Recent Action on Net Metering, Rate Design, and Solar Ownership Policies 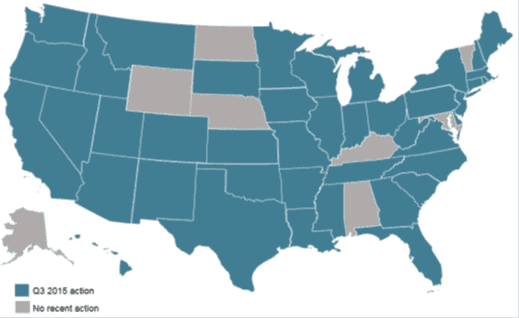 (Source: N.C. Clean Energy Technology Center, 50 States of Solar: A Quarterly Look at America’s Fast-Evolving Distributed Solar Policy Conversation.) One state that has remained below the solar radar is suggesting a new approach for addressing solar rate design concerns. Maine’s new proposal for replacing net energy metering with a market aggregator is making ripples in the solar policy world for its innovative ratepayer-focused approach. The proposal contemplates the creation of a market aggregator that would purchase energy, RECs, capacity value, and ancillary services potential from distributed energy generators at a fixed per-kWh rate guaranteed under a 20-year contract. Centralizing procurement is supposed to reduce transaction costs and create new opportunities for the aggregator to sell the different attributes solar energy provides in applicable markets. Based on a Maine Public Utility Commission March 2015 study that estimated the value of distributed solar at $0.337/kWh, the proposal suggests a starting purchase price from distributed energy generators of $0.20/kWh, higher than the current net energy metering rate ($0.13/kWh) but lower than the $0.337/kWh Maine value of solar estimate. The Public Utility Commission can set a different rate (higher/ lower) based on market conditions and other criteria (there is a lower rate for small commercial projects of 1 to 5 MW). For the wholesale distributed generation market, the aggregator will conduct a quarterly reverse auction for specified levels of installed capacity, with the lowest offer winning a purchase contract from the aggregator who then sells the energy and attributes in the applicable markets. The program is hailed by solar advocates, utilities, and regulators as meeting the needs of all stakeholders involved. Solar customers enjoy rate certainty for a period of twenty years, which is the common term for solar equipment financing. At the same time, all ratepayers are set to enjoy the revenues from the sale of the aggregated energy and attributes in wholesale markets, which are to be allocated equally across the entire rate base. Overview of Market Transactions 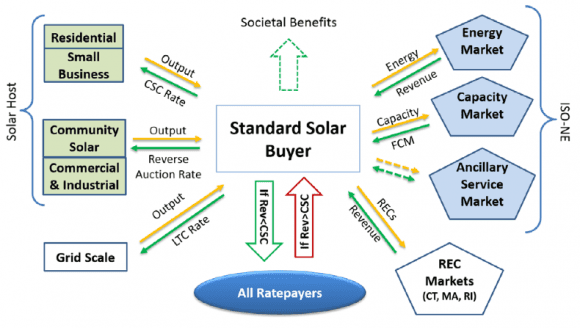 (Source: Strategen, A Ratepayer Focused Strategy for Distributed Solar in Maine.)
The bill incorporating the new solar program was endorsed by a bipartisan group of lawmakers, environmental organizations, utilities, solar installers, and consumer advocates. According to the bill’s sponsors, the new program will not only boost Maine’s solar industry but also save $100 million for ratepayers. For those who thought that community solar marks the second revolution in the solar market, Maine’s promising new solar purchase program serves as another example of how aggregation of solar generation and attributes could increase returns for all parties involved. The emerging lesson from these two examples is that with solar energy, economies of scale could be achieved without unnecessary investments in large and expensive infrastructure. Innovative market models and creative policy approaches will determine the next leaders of the solar world. Yes, we agree - energy storage is confusing. There are over 70 new battery chemistries being tested or manufactured today. And batteries are just a subset of energy storage more broadly; remember flywheels, pumped hydro, and compressed air? Consider the fun graph about technology maturity on the following page to be further confused. However, if you are providing financing, guarantees, or warranties for energy storage systems, note that the market has validated just one battery technology: Lithium-ion. This chemistry made up 96% of all 2015 energy storage installations by capacity. This is not to say, however, that your energy storage investment strategy over the long term is without risk. Consider three supply chain risks regarding lithium. These may cause a shift to other battery technologies, such as flow batteries: Source: Depending on the year, very little lithium is harvested in the U.S. Moreover, production is controlled largely by just 3 - 4 major companies, which some refer to as an oligarchical structure. Energy Storage Technology by Maturity 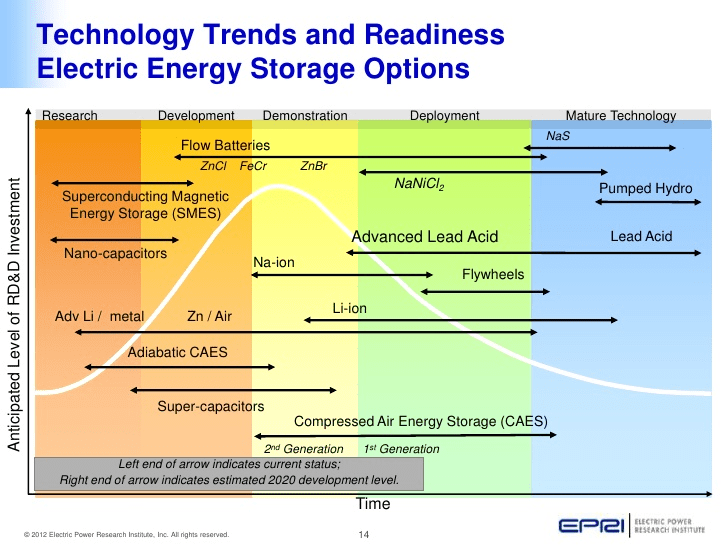 (Source: EPRI) Demand: Global demand for lithium is expected to grow 2x by 2025; as one example, Goldman Sachs suggests that new Tesla Gigafactory alone could consume 17% of current supply. Consider the graph on the following page showing the link between electric vehicle market growth and falling battery costs, which make up ⅓ of car costs. Supply: There is no shortage of lithium reserves. According to the USGS, even if the world increased lithium production 3x from today’s levels, we would still have 135 years of supply. However, what we care about is not reserves but instead the amount of lithium that can be brought to market in time to match the rapidly growing demand from energy storage for grid management, peak shaving, smartphones, laptops, and the many other uses for this precious mineral. And experts suggest that supply will stay below demand for years to come. Lithium Production by Country 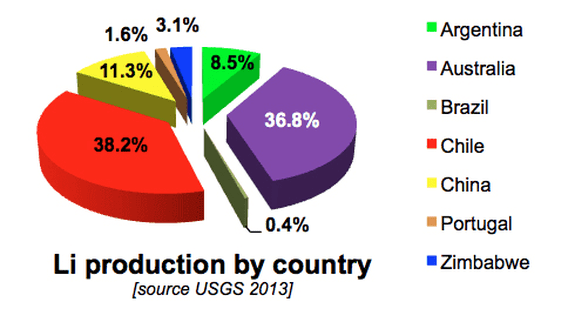 Source: U.S. Geological Survey Falling Lithium-ion Battery Packs (left) vs. Annual Demand for EV Battery Power (right) 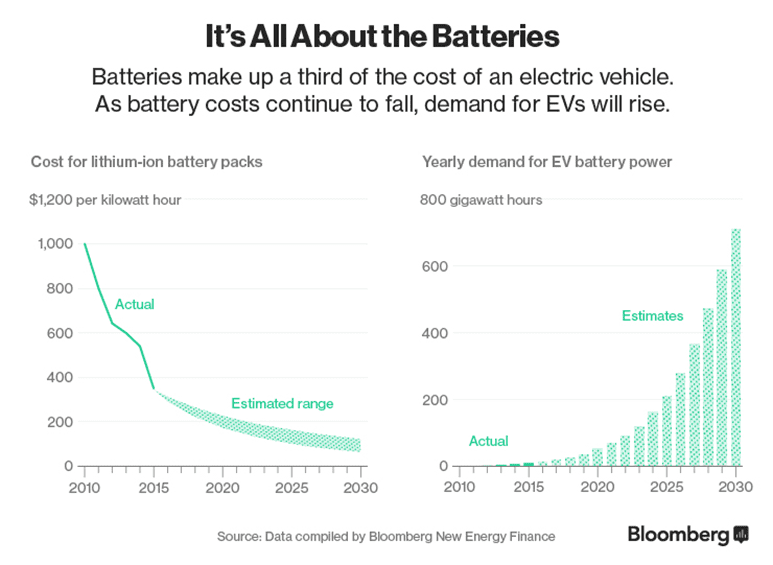 Energy storage investment opportunities are vast, but they are not all the same First, let’s take a look at the big picture: Consider GTM’s U.S. energy storage highlights from 2014 and 2015 (on the next page). Here are five things that stand out:
Energy Storage Scorecard 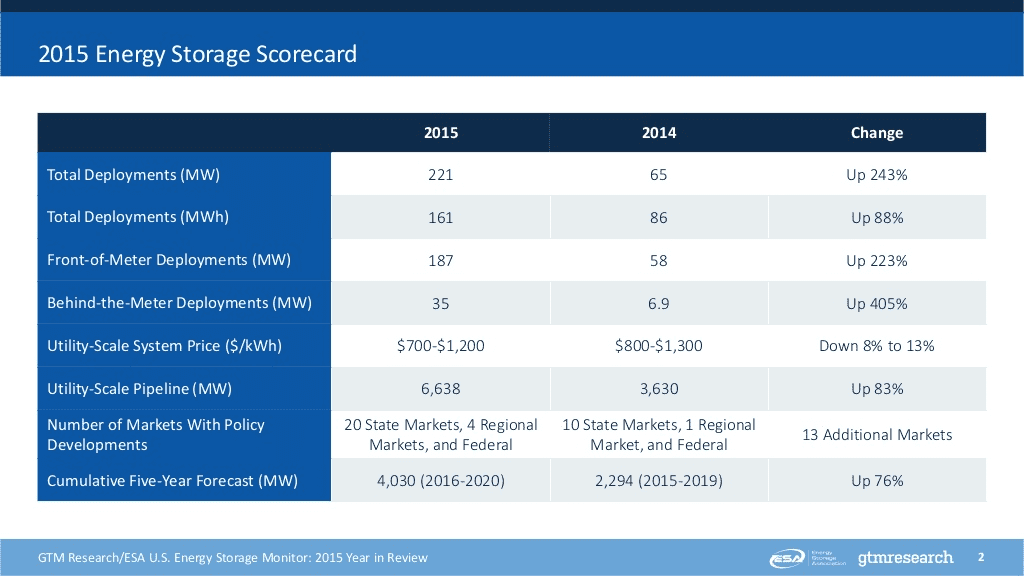 (Source: GTM) As another source of variation in this market growth, consider the graphs below and on the next page. While utility-focused systems dominate today, by 2020 the split becomes more comparable among utility, commercial, community, and residential applications of energy storage. Energy Storage Investment by Sector: 2012 to 2020 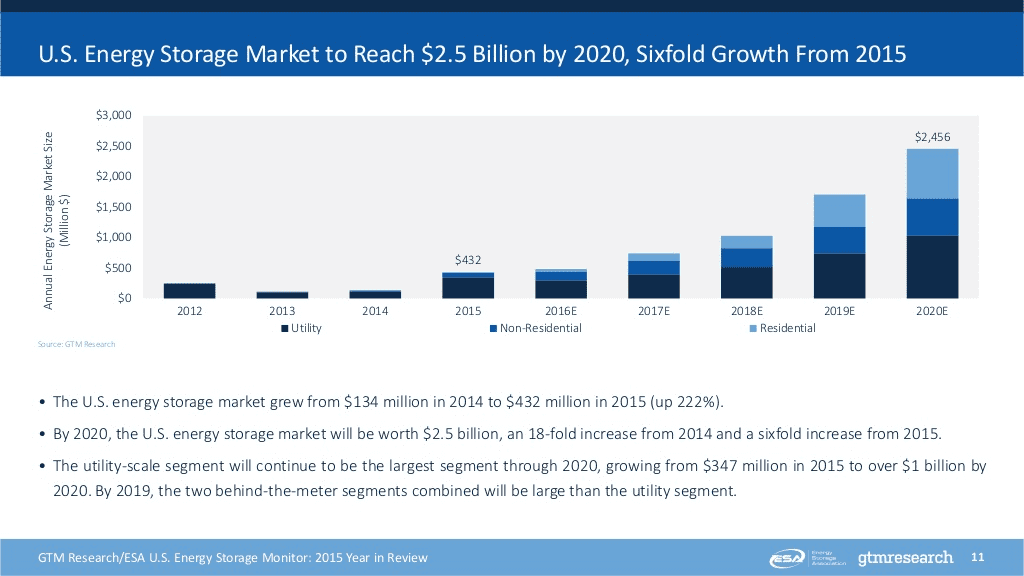 (Source: GTM) Energy Storage Investment by Sector: 2014 to 2024 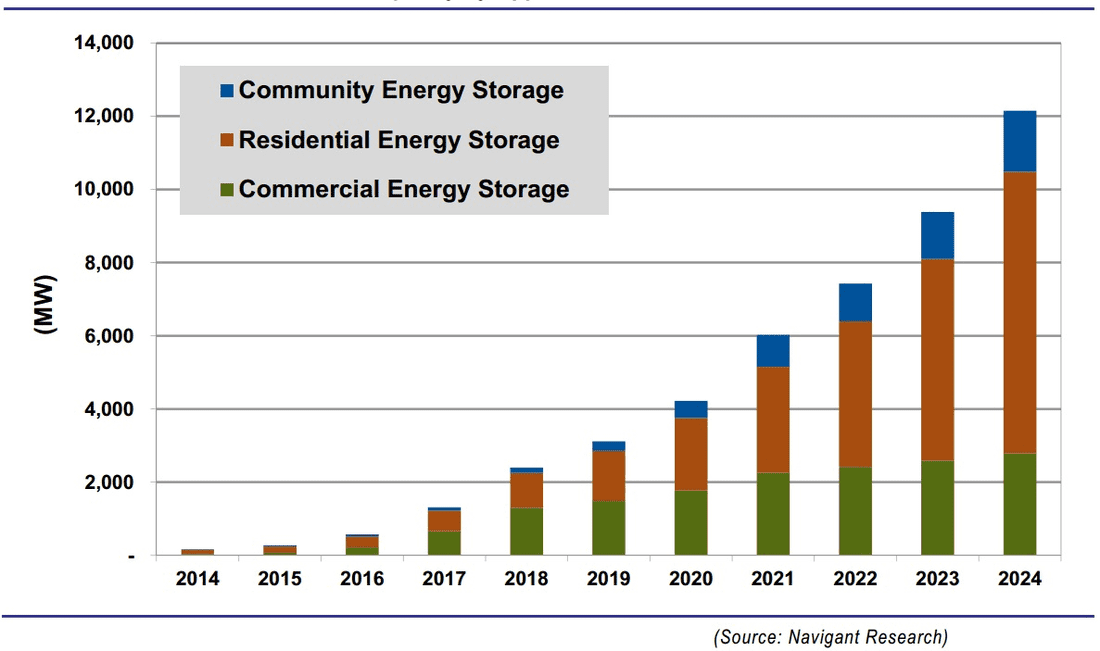 (Source: Navigant) Lastly, consider how energy storage investment opportunities vary based on the type of service provided at the utility level (graph below). The type of service most needed will also vary by state and utility, and drivers will be tied to policy, unregulated versus regulated market structures, degree of deferred grid investment, and a host of other factors. Navigant projects that revenue from this sub-market will exceed $15B by 2024. Energy Storage Capacity by Grid Service: 2014 to 2024 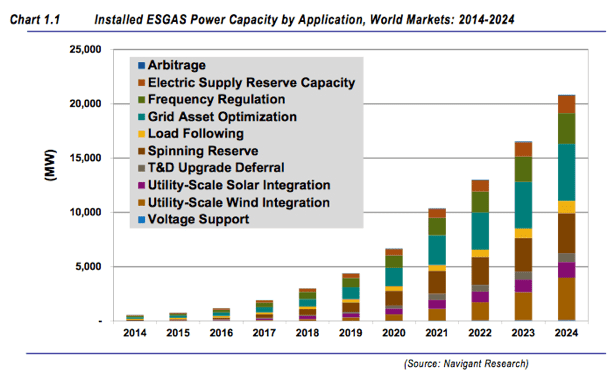 (Source: Navigant)
First, states across the country are rapidly reaching grid parity, a long-awaited panacea for the persistent U.S. solar industry. As a quick refresher, grid parity occurs when the cost of generating renewable electricity falls below the cost of purchasing power from electric utilities. Said another way, grid parity makes switching to renewable energy a no-brainer. There are now 20 U.S. states that have reached grid parity as solar installation costs have continued to decline and retail electricity rates have continued to rise. Second, more than 50% of new utility-scale solar in the U.S. in 2016 will be driven by non-RPS obligated development. Although state-mandated renewable portfolio standards have bolstered utility-scale development in past years, the economics of solar now stand on their own enough to support the majority of new utility-scale installations. Let’s dive into what’s driving this sharp increase in mostly voluntary, large-scale development.
Among the 19 states with more than 50 MW of non-RPS, utility-scale development slated for 2016, some unlikely players in the Southeast appear, including SC, GA, FL, AL, MS, and AR. Although large-scale development is a positive sign within these emerging markets, retail customers rarely have the opportunity to directly participate in the benefits of a diversified fuel mix. The West Coast includes much more intriguing markets, including states like Oregon, which just this week passed a senate bill to incentivize utility scale development between 2 and 10 megawatts. California’s progressive utility companies are further up the learning curve and are now directly engaging retail customers in large-scale solar development, just not always for the customer’s benefit. For example, Marin Clean Energy, a community choice energy program, offers retail customers the option of procuring 50% or 100% of their power demand from utility-owned solar farms at rates that are about 3.5% below current retail rates. On the other hand, PG&E, through their Solar Choice program, offers customers the ability to opt into solar at a premium of 3.58 cents per kWh compared to current retail rates, meaning PG&E is charging their customers more if they choose to power their homes or businesses using solar. Although the Solar Choice program accomplishes similar goals of community solar, including access to solar for renters and homeowners with homes that are unsuitable for on-site PV generation, PG&E is actually using their own customer base as off-takers with PPA pricing that far exceeds competitive pricing for traditional utility-scale development. It makes sense that historically conservative utilities across the country are now embracing large, centralized solar generation, but the hope is that a growing number of consumers will also begin to benefit from the cost-effectiveness of utility-scale PV generation. Corporates and communities ramp up 2016 pipeline The EIA expects 9.5 GW of new solar capacity to come online in the U.S. in 2016. This comes one year after the solar industry added a record breaking 7.3 GW of new solar capacity, marking the first time in U.S. history that solar exceeded natural gas in terms of new capacity coming online. In addition to the notable increases in utility-scale generation, corporate buyers emerged as a major participant in the large-scale generation market. Companies like Apple, General Motors, Google, and Lockheed Martin are ramping up solar generation to power their own facilities, creating a giant marketplace that barely existed just one year earlier. According to the Rocky Mountain Institute, corporate purchases of renewable energy tripled in 2015 with more than 3.4 GW of installed capacity. However, 15 of the 20 announced deals were from first-time corporate buyers, so the jury is out on whether this pace can be sustained in 2016. Much has been written about the growth of the community solar marketplace, and if we had to guess, industry estimates are actually conservative. New community solar programs seem to be announced daily, including a provision within the same Oregon solar bill mentioned earlier. New York is rumored to have pent up demand for community solar developments, and Minnesota’s community solar market is red hot. It was reported this week that BHE Renewables, a subsidiary of Warren Buffet’s Berkshire Hathaway Energy, purchased a 66 MW community solar portfolio comprised of 21 projects across 16 counties in Minnesota. The developer, Geronimo Energy, had previously sold 34 MW of Minnesota-based community solar to BHE Renewables, and seems poised for additional development with BHE Renewables as the take out partner. We will continue to keep tabs on the progress of both community solar and corporate solar purchases throughout this high-growth period. Monthly and Annual Range of Wholesale Electricity Prices 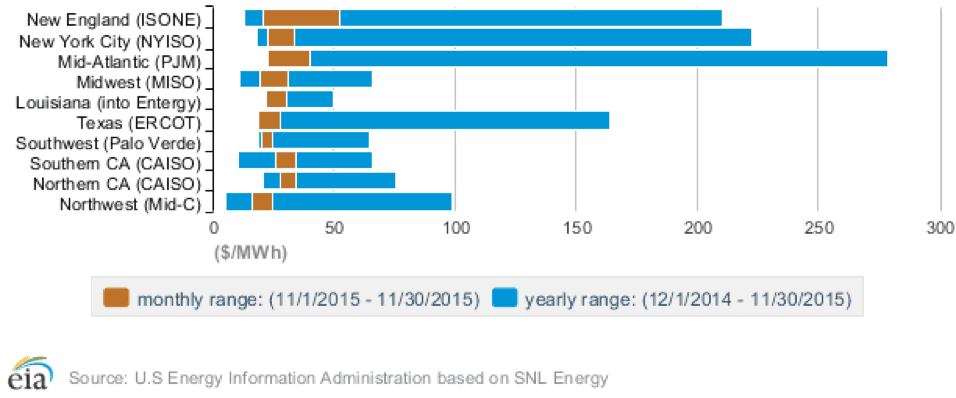 (Source: EIA)
Related data points:
PPAs are getting structured with shorter terms, which actually may end up being a boon for solar project investors Contracted revenue provides the basis of solar project financing. When long-term power purchase agreements (PPAs) came into use for solar projects, they created stable cash flows that risk averse investors could trust. The simplest solar projects being built today still rely on PPAs that typically range from 15 to 20 years. This PPA model is being adapted to current market conditions, with some potentially unintended consequences. Recently, evidence is mounting in regulated markets that utilities are signing PPAs for shorter durations. For example, Duke Energy, serving more customers than any utility in the U.S., is now consistently on record as offering progressively lower PPA rates over shorter timeframes. For a solar project developer, this can be seen as problematic, as you now have a shorter period of secure cash flows generated by your project, which could undermine the basis for a project’s valuation. But this all hinges on what you believe about the future of wholesale electricity prices. Once the term of a PPA is complete for generators that are “in front of the meter,” an option is often available to then switch to selling the electricity generated on the wholesale markets. Given the downward trends in PPA rates, which are now consistently falling below the $60/MWh threshold, the wholesale market may end up yielding higher returns if wholesale rates increase according to industry projections. Thus, a solar project with a shorter PPA may end up yielding higher returns than one with a longer PPA, albeit with some additional merchant risk associated with participating in wholesale markets. Quantifying merchant risk can be a complex task, and is not to be disregarded, but neither does it need to render a project financially infeasible. Are utilities preparing for a future with higher natural gas prices? From the perspective of the utility negotiating the PPA, there are some interesting implications for why a utility like Duke Energy would want to short-term negotiate PPAs. Fundamentally, they must believe that electricity generation will not get substantially more expensive in the future. This is likely a product of the mantra that natural gas prices will remain low for the foreseeable future, an assertion that does not seem to be supported by an objective forecast of the price of natural gas. If natural gas prices rebound in the future, as they inevitably will at some point, wouldn’t it be prudent to have a portfolio of long-term solar PPAs to keep electricity retail rates from spiking? This possibility seems largely absent from the current thinking around PPAs, even as electricity generation from solar has become cheaper than natural gas. n addition, there must be the belief that solar PPAs and other equivalent electricity sources will become progressively cheaper in the future. If trends from the past decade are any indication, this is a safe bet. Yes, solar costs are projected to continue rampant decreases in costs over both the near- and long-term future. So, the solar PPA that Duke signs in 2018 will likely be at a lower rate than the one signed in 2016. But, if natural gas prices do not support continued expansion of natural gas power plants, can solar project pipelines be able to make up the difference? Perhaps, but it is no sure bet. Thus, the question is one of scale and hedge risk against a future in which today’s anomalously low natural gas prices do not continue in perpetuity. Evolution of solar project investing is driving out investors seeking high yield As solar project finance emerged from its inception as a niche market to a broadly appealing investment class, the search for risk-adjusted returns has naturally become more of a challenge. Early investors in solar project finance were attracted by the double-digit return potential based on long-term contracted cash flows. As the perception of high technology risk receded into the past, the overall risk profile of solar projects started to look more like bonds and other fixed income assets. Stable and predictable cash flows backed by a tangible asset coupled with very low long-term operating costs and free fuel made for an enticing proposition. Looking over a cash flow statement, solar projects started to look like many other revenue generating infrastructure assets - bridges, toll booths, pipelines, etc. Large infrastructure funds and other investors familiar with these types of revenue generating assets entered the market and started to compete with the incumbents, specialty investment funds. But now we are seeing a new type of entrant into the market. Now, the cat is out of the bag, so to speak. Solar project investing is no longer a niche activity, and there is a swell of interest in acquiring solar projects for their predictable cash flows. But as the solar industry has matured, there is less value being left on the table. Or rather, solar investors are no longer able to easily generate unlevered returns in the double digits, at least not without the help of incentive programs such as SRECs to generate revenue outside of the PPA structure. Whereas private equity and investment funds with higher costs of capital have been big players in financing solar projects to date, we may be seeing a shift to banks, insurance companies, and institutional investors with large appetites for low risk, and more modest returns over long time horizons. As large solar portfolios start to enter the market seeking investors, increasingly they may be turning to the funds with the greatest tolerance for lower returns. Their success in this market will depend upon how quickly that can become savvy on the intricacies of solar project finance. Further reading:
|
sign up for ironoak's NewsletterSent about twice per month, these 3-minute digests include bullets on:
Renewable energy | Cleantech & mobility | Finance & entrepreneurship | Attempts at humor (what?) author
Photo by Patrick Fore on Unsplash
|

© 2009-2022 IronOak Energy Capital, LLC | (888) 249-3013