
|
Most investors we talk to are not investing in electric vehicles for a few reasons:
In this and our future market insight pieces, we’ll address these concerns. Yep, the EV market is tiny, but it will be mainstream in just a few years. The time to get smart on EVs and take action is now. The data below is from the good folks at Deutsche Bank. Note a 3x growth by 2020 and 5x growth by 2025.  Who’s winning the EV race? 1. Duh, it’s Tesla. 2. What? Tesla is not the only EV in the world? 3. The competition is global. Many investors have never heard of some leading EV car lines. Again, great stuff from the environmental NGO....uh...I mean, global investment giant Deutsche Bank. Kudos. Which ducks do you see?The California Independent System Operator (CAISO) can be commended for providing an accessible daily data dump on renewable usage across its system. With these data one can construct various “duck curves” for the grid’s daily net load profile, the shapes of which result from the rising penetration of a variable energy resources (VER) such as wind or solar. VERs exhibit four characteristics:
Duck curves are in essence the daily net load profiles after accounting for VER generation. They show the required remaining dispatchable energy required to ramp up or down to take up the solar and wind shortfall. As we see from the two examples below, duck curves can take on various forms, often depending on the scale range of the y-axis. 1st flock of ducks: Average net load profiles over seven days around March 31, over 2013-16. 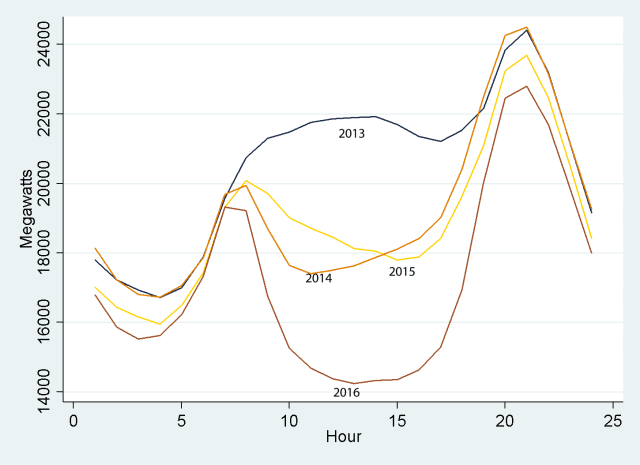 Source: Blog post by Meredith Fowlie, “The Duck Has Landed” (5/2/16), using CAISO data. 2nd flock of ducks: Net load profiles for March 31 for 2012 and 2016. Forecasts for 2017 and 2020 were made in 2013. 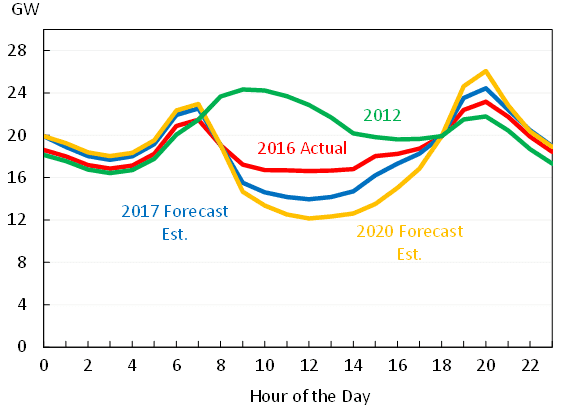 Source: Council of Economic Advisors, The White House, “Incorporating Renewables into the Electric Grid: Expanding Opportunities for Smart Markets and Energy Storage,” Fig., 4 (June, 2016), using CAISO data.
Both sets of curves cover almost exactly the same sets of data, with the first emphasizing a more extreme story. The the stories are essentially the same -- net load after VERs bottoms during the day when solar is peaking, ramps up very quickly as solar generation drops off dramatically and evening usage rises, and then drops again as nighttime usage drops and wind picks up. The takeaways are two:
Ancillary services as regulation mileage A recent report from the Council of Economic Advisors at the White House goes deeper, looking at some ways of understanding the value of energy storage via the idea of regulation mileage. The concept measures the changes -- increases or decreases -- in power output that a grid operator requests from an electricity generation resource over a specific timeframe. It would stand to reason that regulation mileage, a proxy for the amount of ancillary services required, would be determined by several factors. The Council’s study looks at the total load, the amount of that load from VERs, the slopes of each of those load curves, and a series of effects that are specific to the hour of the day, day of the week, and week of the year that the electricity is generated. Among other results, and as expected, one of the clearest that appears is that the slopes of the load and VER generation have a lot to do with the services required. In other words, the faster the late-afternoon ramp up at the end of a sunny day, the more energy storage will be wanted. Valuing storage based on its ancillary benefits What are other approaches to valuing energy storage in these settings? The peer-reviewed journal Nature Energy recently carried the results of a new study on capturing the full benefits of energy storage in investments. Applying a techno-economic model, the authors of ”Limiting the public cost of stationary battery deployment by combining applications,” find that battery storage becomes more attractive as an investment as each storage facility offers more energy services. An article summary carries the message that energy storage apart from pumped hydro is, “still considered unattractive by investors on mainly two grounds: cost-competitiveness with other technologies and the absence of a commonly shared classification of electrical storage as a competitive or regulated activity -- that is, as an electricity generation asset or network component” (emphasis added). The drawn conclusions are that the best way to incorporate all of these benefits are to remove non-market barriers, a legacy of rules that were originally written for conventional generators. According to the summary, these “institutional and regulatory frameworks are key elements in the determination of the economic value of storage,” and “economic principles require new, enabling rules to be technology neutral, that is, not directed at the diffusion of storage or any other technology in particular.” The article calls for three such policy recommendations:
This policy neutrality from above is a point worth repeating. In revising public policies, the goal is not the promotion of energy storage out of any favoritism towards the technology. Rather, the point is to promote energy storage as an enabler for VERs such as solar and wind, which in turn leads to progress on an overall societal goal of reducing greenhouse gas emissions. 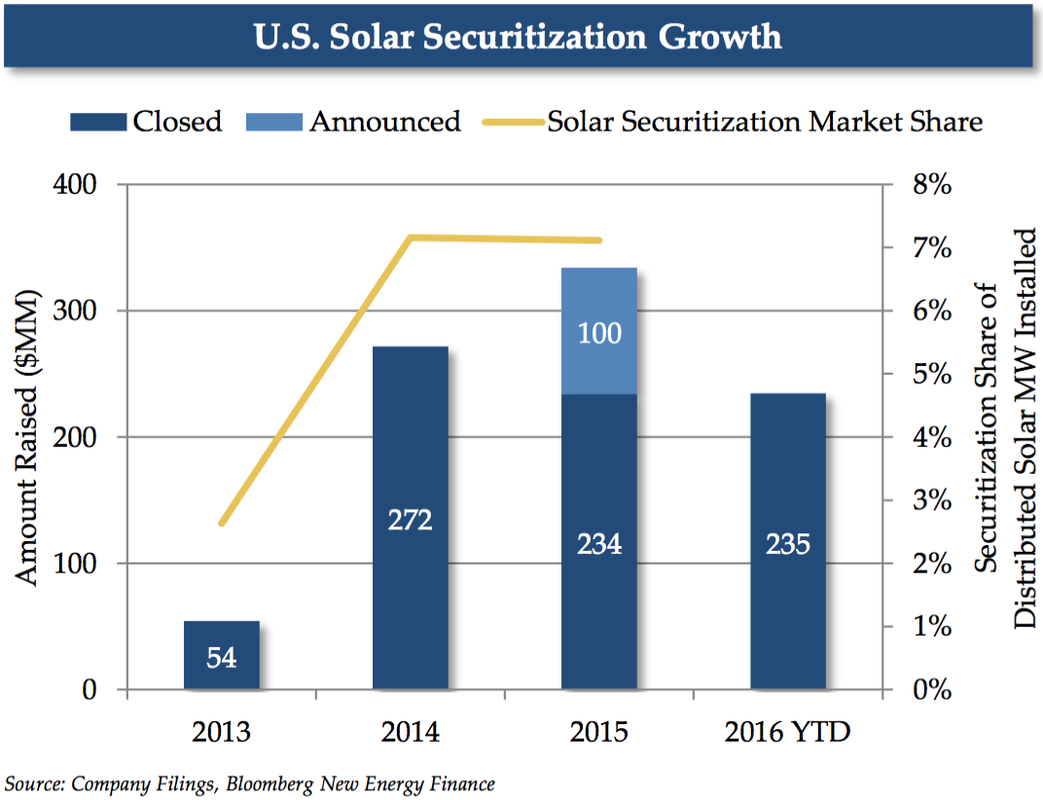 Solar securitization has been a popular theme at IronOak Energy, and for good reason. Access to gobs of low cost capital is every solar developer’s dream, along with, of course, limitless net metering (but what about Value of Solar?), a permanent ITC (debatable), and friendly utilities (now you know I am reaching - just kidding...kind of). As opposed to the other items on the solar developer wishlist, solar securitization is actually happening in real time. Pioneering companies like SolarCity and SunRun are paving the way with new securities offerings as we speak. The market is not huge, but has crested the $300M mark in 2015. This past January, SolarCity completed its first securitization of distributed solar loans, and achieved the industry’s first investment credit rating. Others will undoubtedly follow, if the way is clear. Back in June of 2015, we wrote about the idea of solar securitization finding more traction in the market. But, be careful what you wish for. While securitization may be the shiny new-ish finance toy for the solar industry, it is not a one-size-fits-all solution to finance (or refinance) projects. But be wary of the double-edged sword of solar securitization The solar industry rides on the shoulders of tax equity investors, at least until the ITC is phased out. As such, one must consider — how would securitization change the project finance equation? For one, securitization would expose tax equity investors to potential recapture of any unvested credits. Translation - backing a security with projects that do not utilize any tax equity will make the deal much simpler and more palatable. But who wants to leave money on the table? Luckily, the inverted lease was designed to tackle sticky tax equity issues like this and can be used to mitigate this recapture risk. As of 2014, SolarCity and SunRun started to create solar securities primarily of inverted lease arrangements. Problem solved. But that is not really the only issue that should concern project developers. The dark cloud hanging over solar securitization is that developers or third-party asset owners would have some of their upside undercut due to the fact that their equity in the underlying assets relies on retained value. Equity holders are always at the end of the cashflow line, but adding security holders to the mix places yet another claim on the project cashflows before equity holders get a piece of the pie. And that pie needs to be comprised of sweet, high-grade offtakers. As we all witnessed in the mortgage-backed security debacle, bundling lots of disparate (even toxic!) assets into a nicely packaged security may doop the market for a while, but it will come back to bite you. The same holds for solar-backed securities. Which means that not every residential or C+I solar project is going to pass muster as a security-grade product. This is one of the reasons that the initial transaction costs for creating a security are substantially higher than essentially any other project finance mechanism. High transaction costs along with the additional cost burden of compliance reporting can start to eat into that delectable low cost of capital, unless you have your ducks in the row. Some seriously good reasons to dip your toes into the securitization pool The first thing that you probably said when trying to sound smart about investing was “diversification.” I’ll wager the second thing you said (and you really had no idea what this meant) was “liquidity.” Diversification and liquidity are two of the primary ingredients in the low cost of capital cake mix. Diversification because high concentrations in terms of geography, offtakers, operations, and policy attract those pesky risk premiums that increase the cost of capital. Liquidity because it is the lubricant that allows markets to function and buyers and sellers to repeatedly engage in transactions. Add in a little sponsor bankruptcy risk mitigation and some public credit ratings to the mix and you have the makings of a very enticing offering to gargantuan fixed income institutional investor class. And what do institutional investors like more than anything? You guessed, boring standardization. All those legal and accounting fees that allow you to create boring, standardized securities also unlocks a velocity and scale of financing that could leave traditional project financing in the dust. Institutional investors have been invited to table, but will they dine? As we know, institutional investors have a big appetite, which, in the case of solar, has meant that they can only find the requisite scale in bigger utility-scale deals. Securitization could hold the key to allowing smaller residential and C+I projects to access lower cost capital from institutional investors. This issue of scale is a big one though. Securities of the size that would attract institutional investors have been few and far between. The question of the day is who can follow SolarCity and SunRun’s lead to bring the solar securitization market out of the hundreds of millions and into the billions. Related data points:
Further reading:
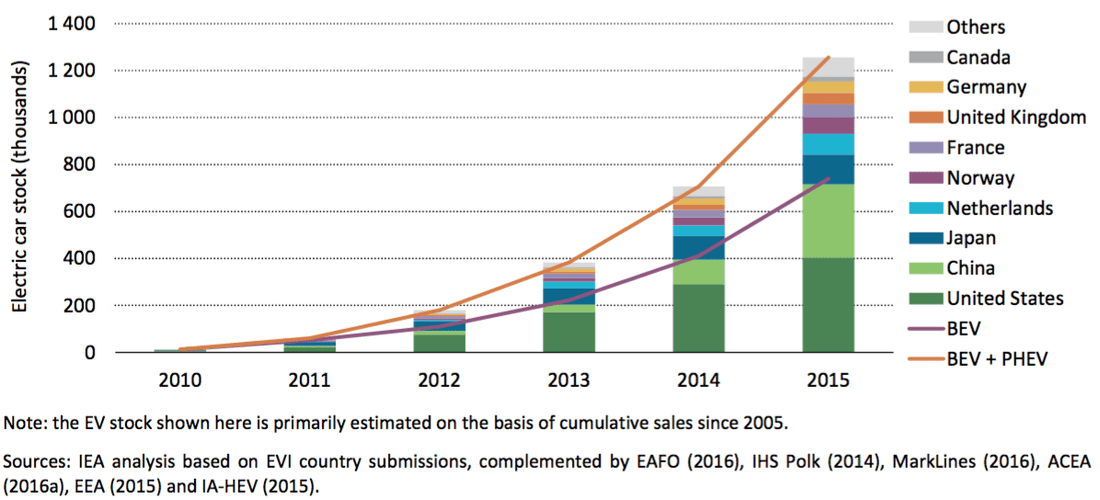 (Source: IEA) The International Energy Agency must love the Stanley Cup Playoffs because their recently published Global EV Outlook was full of hockey sticks! The hockey stick graph, you may recall, was popularized as a key piece of evidence supporting the existence of climate change. Rest assured, there will be no debate of climate change here. I am a deep believer in the appropriate use of sports metaphors to describe complex phenomena. The greenhouse gas emissions hockey stick graph tells about as simple a story as can be told about climate change. The hockey stick is a pithy way of showing how a creeping linear trend jumps into an exponential growth (or decay) phase. Our minds are wary of things that change exponentially. They are just not normal. That is because from one time period to the next, your worldview, let’s call it your umwelt, is dramatically different. Yet, as history shows, this Law of Accelerating Returns holds to key to understanding technological progress over the course of history. We see hockey sticks everywhere now. Some, we should get excited about like renewable energy deployment. Others, we might be wary of like the growth of the economy. Some indicate a phase shift, as in the case of the transition to renewable energy. Others might indicate a boom-and-bust cycle, with exponential growth followed by precipitous declines. The trick is understanding the underlying drivers of change. So, about EVs. Not long ago, EVs were very rare, too expensive, and only the most ostentatious environmentalist among your friends was even considering buying one. Skip ahead five years, and all of sudden, your umwelt has changed. The Law of Accelerating Returns has been hard at work. Now, you are starting to see EVs everywhere you look, EV charging stations are taking up the best parking spots, and your neighbor down the street likes to park their EV in the driveway to show it off while it charges. And this is just the beginning. 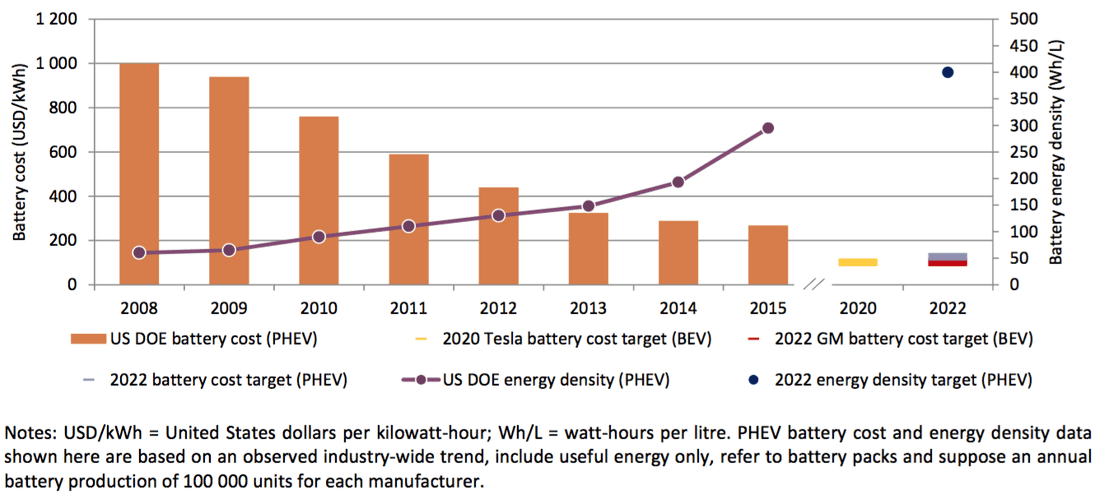 (Source: IEA)
What changed? Well, largely it was a story of rapid technological innovation leading to dramatic cost reductions. The most important of these is with the battery, of course. As batteries make up around ⅓ of the cost of an EV, the increases in energy density coupled with the reduction in battery cost have started to bring EV costs down from the stratosphere. And not to dismiss, also helped alleviate the all-important “range anxiety.” We Americans do have a pastime of hitting the open (or congested) road without a worry until the next gas station. If battery technology continues its march of progress, look out for the Law of Accelerating Returns to come into full force in the EV sector. Feed In Tariff (FIT) programs have been the lynchpin of solar growth, but is it time to move on? 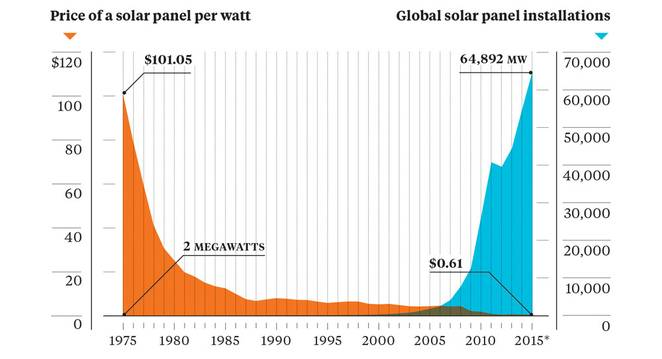 Source: Earth Policy Institute/Bloomberg Feed-in tariff (FIT) programs were designed to entice new entrants into the solar market during a time of learning and experimentation. Initially, they were designed as value-based instruments in which compensation was tied to various external benefits, such as avoided externalities (fancy term for coal plant pollution). But this model was a bit pie-in-the-sky, and left a lot of uncertainty and unpredictability on the table for investors and developers to navigate. The resulting high project financing costs ended up being a major deterrent to the type of catalytic growth that was hoped for. The real magic of the feed-in-tariff was unlocked when there was a shift to cost-based instruments, wherein a solar developer would get compensated for the costs of development plus some reasonable rate of return. The fixed-rate, long-term guarantee of cash flows was music to investors’ ears, and the solar market was off to the races all across the EU, China, India, and South Africa. Interestingly, no North American country has instituted a FIT program to date, and rather have opted for more circuitous policies such as Renewable Portfolio Standards. We now have a solid track record by which to evaluate the successes (and failures) of FIT programs around the world. On the surface, much of the success of solar markets worldwide is attributed to FIT programs. But there is a creeping concern that this success will not last much longer. FIT programs solved one problem by creating stable, long-term cash flows for solar projects, which could be underwritten and financed by savvy investors. This accelerated adoption and experimentation with different technologies and business models, but more importantly it sped up learning (decreases in costs due to experience or scale). In solving this market catalyst problem in the short term, governments left the door open in the long-term for gaming the system if and when solar prices (really LCOE) started to dip well under the FIT rates. And that is precisely what has started to happen. The bull rush to obtain legacy FIT program rates once technology costs plummeted has fueled a massive boom in solar. On the the surface, this seems like a great problem to have. More solar! But, this is a case of too much too soon, and governments are responding by pulling back on their FIT programs and leaving a wake of solar developers scrambling to make their projects pencil. 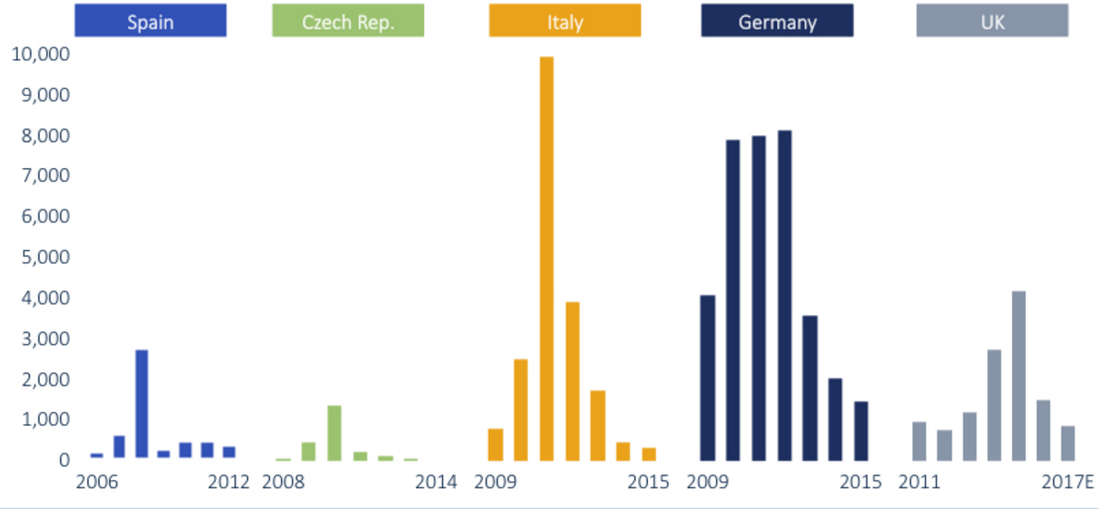 Source: GTM Research The European renewable miracle has been taking some nasty hits lately. Even the energy transition darling, Germany, has not been immune to the pervasive bust cycle that is spreading across the continent. What changed so quickly, you may ask? Well, it is the classic story of a good thing gone bad. The FIT programs that accelerated solar adoption so quickly in years past are now becoming the victim of their own success. Where they erred was in making the terms so enticing for so long that they ended up overheating the solar market. There is a delicate balance between creating an incentive to attract risk-taking early adopters and reducing or retracting the incentive once the economics of the market support broad participation. Or, in other words, they just let too many players at the table, and this time, the cards were stacked against the house. Governments underestimated the speed at which solar prices would fall, which left them in the undesirable position of having already committed to paying well above market prices. It was boom times for the solar industry, but it could not last. The graphs above look like tulip mania (if this reference eludes you, please read for some amazing dinner table chatter) for crying out loud. Germany had three years of putting over 8 GW online. Italy spiked in 2011 with nearly 10 GW of solar, only to plummet to under half of that in the following year. The UK has witnessed a remarkable growth in solar, only to cut the FIT program by 65% in one fell swoop. Similar patterns were seen in many other EU countries. And let’s not forget Japan, whose boom-bust cycle dwarfs those of all of the ill-fated EU countries already mentioned. Japan is still in the top 3 globally in terms of annual solar capacity installed, but is headed for a protracted decline in solar over the years to come, again due to an over-aggressive FIT program. But FIT programs are so simple and elegant. What alternatives exist, you may ask? 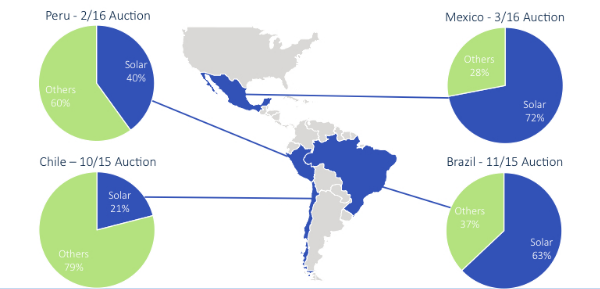 Source: GTM Research Letting go of a good thing is hard, especially for an industry like solar that may suffer from a tinge of PTSD from the head-spinning boom-bust cycles of the past decades.
After all, with the FIT structure solar did not necessarily have to directly compete with other generation technologies. A decade ago, that was just fine because solar would not have been competitive. Solar needed an incubation period to slide down the learning curve to lower, more competitive prices and meaningful deployment scale. Now that solar can tout itself as being one of the most cost effective electric generation technologies out there, there needs to be an increasing willingness to actually compete in markets with other generation technologies. Latin America has started to buck the FIT model in favor of an auction process in which solar competes with other generation technologies, both from independent power producers and incumbent utilities. This has helped feed a boom in Latin American solar, as it turns out that solar can beat out nearly all other generation technologies on a pure LCOE basis. Nearly three quarters of new capacity additions in Mexico will come from solar, easily more than 1 GW. Brazil is in the same league. And various EU countries and India are also doubling down on auctions. But, auctions are not a panacea. We have all seen auctions in the movies, and the meme of the irrationally exuberant bidder going well beyond their true willingness (or ability) to pay in order to secure the prize. While we all hope that power producers are somewhat more measured and rational in their approach to bidding in these markets, there remains the possibility that competing in auctions may drive prices down quickly to unsustainable (even unprofitable) levels. In fact, some early evidence in the auction tea leaves is that even these markets can overheat as bidders aggressively pursue market share. On the one hand, it may be good for business in the short-run, and auctions may effectively accelerate learning and cost reductions. But, on the other hand, auctions run wild may undermine the long-term viability of the ecosystem of power producers feverishly competing to keep up with the Joneses to survive. Exuberant bidding to support short-term growth is not a phenomenon that should feel altogether unfamiliar, as it is precisely what drove SunEdison to bankruptcy. Further reading: As Feed-In Tariffs Wane, Auctions Are Enabling the Next Wave of Solar Cost ImprovementsFeed-in Tariff: A policy tool for encouraging the deployment of renewable energy technologiesInnovative Feed-in Tariff Policy Designs that Limit Policy Costs A Policymaker’s Guide to Feed-in Tariff Policy DesignFeed-in Tariff Policy: Design, Implementation, and RPS Policy Interactions |
sign up for ironoak's NewsletterSent about twice per month, these 3-minute digests include bullets on:
Renewable energy | Cleantech & mobility | Finance & entrepreneurship | Attempts at humor (what?) author
Photo by Patrick Fore on Unsplash
|

© 2009-2022 IronOak Energy Capital, LLC | (888) 249-3013