
|
Recent solar industry headlines (see the latest from Forbes) would suggest that international trade negotiations (or perhaps more precisely, disputes or wars) are among the most important things to know about solar. Opinions vary on the efficacy of such international policy, but suffice it to say that this escalating trade kerfuffle is masking the growing strength of the solar industry. Let’s not get caught up in the headlines. Be smart and take a deeper dive. Part of the beauty of solar is that it comes in many shapes and forms, ranging from utility-scale solar farms to smaller-scale applications on homes and businesses. Here, I want to focus on bread-and-butter solar applications for homes, leaving the bigger, headline-grabbing projects aside. Residential solar is no longer just a “California and a bunch of others” story Far from being a luxury for the rich, residential solar has grown to being a legitimate complement to grid electricity (alternative if paired with energy storage) across the US. Generally speaking, the reason is simple -- cost. On average, residential solar is now cheaper in essentially every state in the US according to SUNMetrix, which produces a state-by-state solar cost comparison analysis. Even if the solar federal tax credit were completely eliminated, only two states would no longer offer cost savings to solar adopters. Figure 1: US Solar Cost Comparison with Grid Electricity 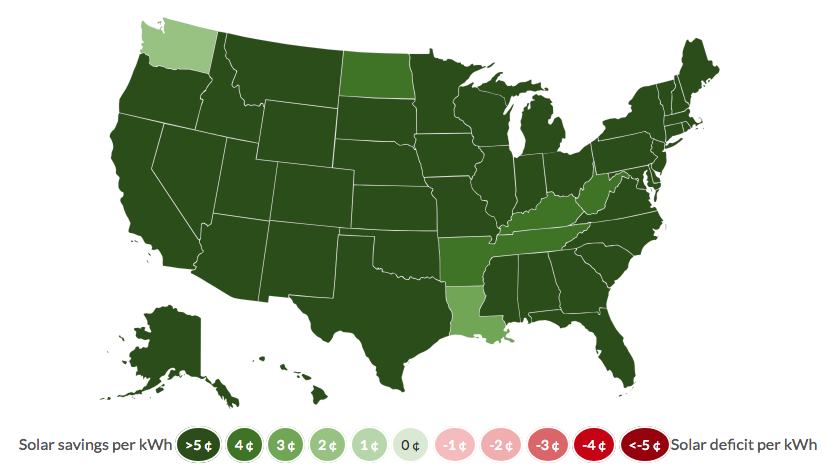 Source: SUNMetrix, 2018 Figure 2: Annual Residential Solar Installations 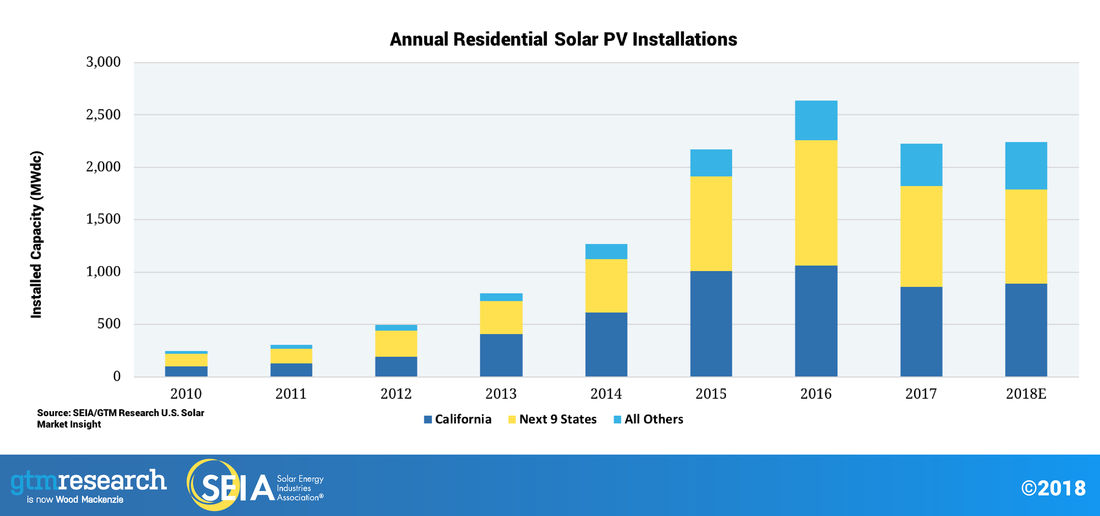 Source: GTM Research & SEIA, 2018 Precipitous reduction in solar costs, and still going Let’s put some numbers to this story. According to the National Renewable Energy Laboratory (NREL), residential solar costs have decreased from a levelized cost of energy (LCOE) of $0.52/kWh in 2010 to $0.151/kWh in 2017, with projections to reach $0.09/kWh or below by 2030 depending on technological innovations. That is over a 70% reduction in solar electricity costs the last 7+ years, with another 40% reduction projected over the next decade or so at a minimum. Translation: The already significant financial benefit of solar will only grow over time. #WhySolar Figure 3: Comparison of Modeled Solar Cost Pathways 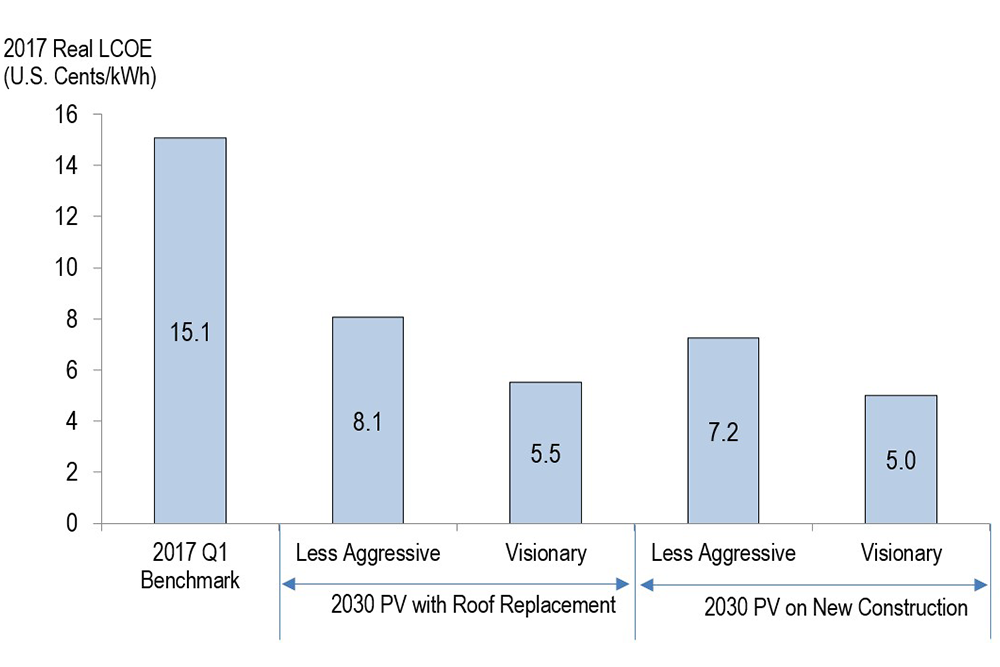 Source: NREL, 2018 The clever skeptic may retort -- this is apples-to-oranges when you compare the average cost of electricity on your utility bill with the initial installation cost of solar. Good point, oh revered skeptic. Initial capital costs to install solar have always been a limiting factor for potential consumers. Fortunately, this is also precisely the problem that was solved in order to unlock the potential of this market. Early on, the solution was for solar companies to offer long-term power purchase agreements (PPAs) to customers. The solar company would install the system at no cost, retain ownership of the system over the long-term, and sell the homeowner power from the solar panels at a specified rate over, say, 20 years. While PPAs still exist, they are giving way to solar loans, which allow the homeowner to retain ownership of the system and pay it down over time as with any other loan. Point being -- there are many options to offset those initial capital costs over a long period of time so that the solar adopter is, in effect, making an apples-to-apples monthly payment. These dramatic cost reductions paired with a wider array of consumer financing options have driven massive growth in market adoption, which is generally what we see in market growth, as shown in the GTM Research graph below. It is not the quintessential hockey stick graph due some policy uncertainty at various times in the past, but the growth trends are apparent, and not projected to abate even after the federal tax credit for solar is eliminated in 2022. Figure 4: US Solar Installation Forecast, 2010-2023E 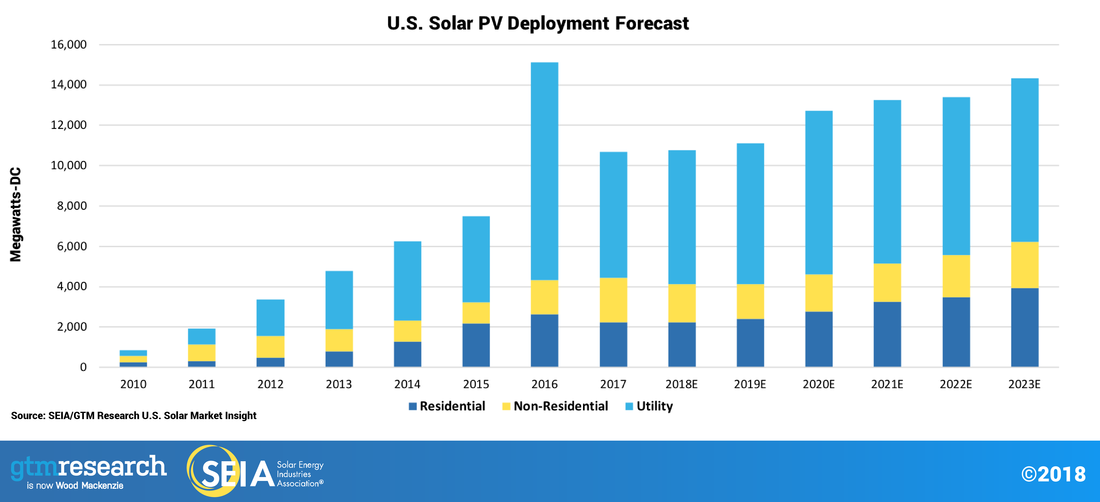 Source: GTM Research & SEIA, 2018 Still miles to go in market potential Even with this rapid market growth, there is still a large untapped, addressable market throughout the US. According to the NREL, there is a 30 GW annual technical market potential for residential solar nationwide across both new construction and roof replacements. “Technical” being the operative word here. There are many factors beyond just technical feasibility that drive market adoption, especially when it comes to a big expenditure for a person’s home. Notwithstanding, the point is clear. The addressable market dwarfs the current market penetration numbers, which were at just above 2 GW in 2017 according to GTM Research. Figure 5: Average estimated annual residential rooftop PV market capacity potential from 2017 – 2030 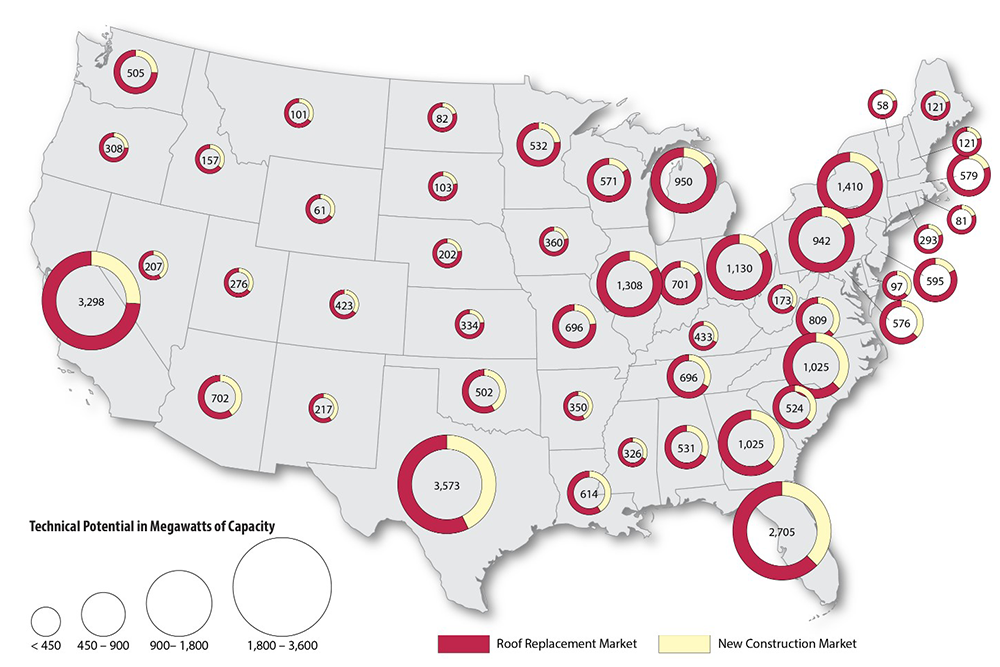 Source: NREL, 2018 Parsing the signal out out the noise among the morass of residential solar companies
At its core, the residential solar business is relatively simple -- sales, equipment, installation. As such, there are fewer barriers to entry compared to many industries, which has paved the way for hordes of supremely adequate solar installation companies. It is the quintessential “two guys (or gals) and a truck” phenomenon. It is not too hard to make reasonable money installing solar systems (at least for a little while), so a bunch of relatively unsophisticated companies are doing it. Yes, you have the publicly traded stars out there -- SunRun, Vivnt, prior to its Tesla acquisition SolarCity, etc. However, these national brands appear to be ceding their market position in many geographies to more locally grown and known companies that are buffeted by the holy grail of marketing, happy customers and word-of-mouth advertising. There is a smorgasbord of these smaller, local and regional companies. Some have really refined operations, well-oiled machines so to speak. Others have slick advertising, but spotty execution. In all cases, it is really difficult to cut through the noise to discern which are positioned to capitalize on the growing market opportunity in residential solar. Here are five hallmarks of a “cream of the crop” residential solar company:
Buyer beware, there is no magic formula to identifying the best performers among residential solar providers. It requires diligence, research, and some perceptive sleuthing to find those diamonds in the rough. The market conditions are ripe, however, for a number of successes to emerge out of this exciting sector. 1. Have no delusions about policy risk -- it exists, but it is not unique to the solar market It is not an uncommon stance for private equity investors to claim that they will not enter markets with “policy risk.” Being someone trained in economics, this statement comes across as somewhat strange, bordering on naive. Markets are policy constructs. There remains some secular ideal of a free market without government or policy intervention. While this may exist out in the far reaches of less formal economies, it is wholly inapplicable to electricity markers. The policy landscape defines the contours of where and what kind of solar development can take place and where capital can be deployed with the reasonable expectation that it can meet investor hurdle rates. Ignore policy at your own peril. The most enterprising investors are constantly searching for ways to anticipate markets movements largely through the lens of policy. That said, if there is anything that will put a damper on sustained investment activity, it is policy uncertainty. And that pertains to everything from state-level mandates to utility-level interconnection practices to local land use planning. While it is relatively easy to have a clear view of the state-level policy, it requires much more on-the-ground knowledge of utilities, permitting agencies, and landowners to really discern where the most productive spaces to invest are. 2. The states rights debate emerges in the electricity market It is easy to assume that the biggest energy-related issue at stake at the federal level is the Clean Power Plan. Of course, whether the CPP makes it through the Trump administration’s grinder is a matter of no small importance, but let’s just say the odds are not in its favor. It’s a shame, as the CPP was never really given a chance to shine (pun intended). There is a larger structural issue at stake concerning federal vs. state jurisdiction. States used to control most of the electricity market regulation, but has started to cede authority to FERC as the electric grid has become more regionalized, interstate electricity markets have formed, and and transmission development issues have cropped up. Yet again, the age-old story of federal vs. state rights comes to bear its head. States have lead the charge with RPS mandates, various compensation schemes for distributed resources such as RECs, implementation of PURPA, and a host of competitive policy issues. And, as any clever investor or developer knows, this has created a remarkably vibrant but fragmented investment landscape for solar in the U.S. FERC is left to argue over who is responsible for creating a coherent picture of this vast mosaic of policy approaches. Left to their own devices, states will forge ahead with their own plans and policies. But that will not necessarily suffice when trying to address regional and national resource adequacy, generation mix, and transmission concerns. Keep an eye out for more rulings on how the energy transition will be governed and regulated at the federal and state level. Especially for states that are behind the curve, so to speak, it will be really impactful on how utilities are regulated and where new emerging markets for solar development and investment emerge. 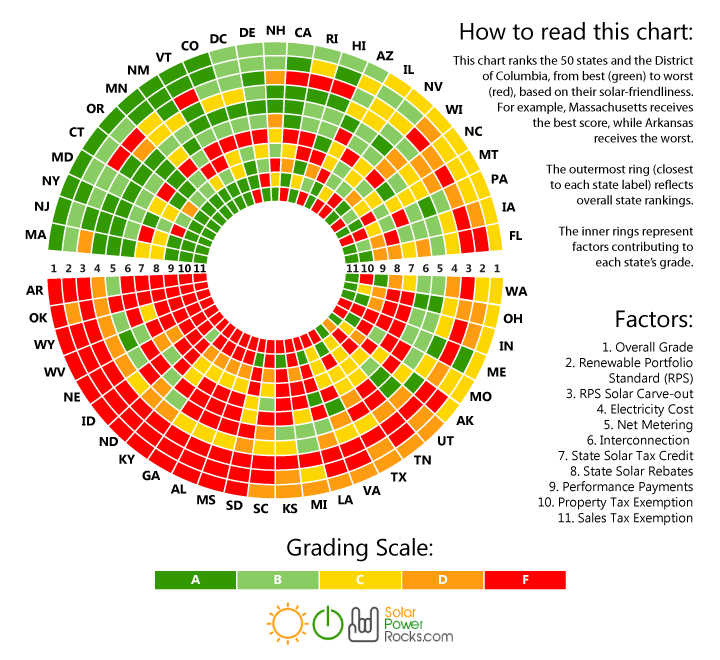 (Source: SolarPowerRocks.com) 3. Grid modernization is essential (and cool sounding), but it’s still going to be a bumpy road The New York REV program gets a lot of love, but don’t forget about California, Massachusetts, and Maryland, among others. Each is whipping up a unique secret sauce to address a docket of issues surrounding utility structures and incentives and the integration of distributed energy resources (DERs). At a high level, efforts such as these will ease the path to higher penetrations of renewables, a long-standing (and perhaps specious) contention of renewable opponents and skeptics. More importantly, these policy initiatives aim to create a more cooperative and predictable environment for developers to build projects and investors to deploy capital in the solar sector. Developers are always interested in more (low cost and patient) capital and high quality pipeline. But, increasing their Christmas wish lists include more certainty and predictability in navigating the increasingly gnarly regulatory landscape. If there is any simple heuristic for forecasting new solar markets, it is where grid modernization processes are underway. If it only were so simple. Where modernization makes developers and investors a little uneasy is how new DER compensation schemes are going to change the value of their development assets and operational projects. From a technical standpoint, it makes all the sense in the world to treat DER according to the value it contributes to the grid. By no means is this easy or straightforward, but there is some logic to doing it. But it is an entirely different matter to get investors comfortable with underwriting projects with significantly different revenue streams. Underwriting solar projects is something that the industry has become quite adept at, and there will be some reluctance in adapting to entirely new structures. If this comes to pass, and we are no longer in a solar world dominated by simple PPAs, then the most enterprising investors will need to lead the charge on how to finance these projects. 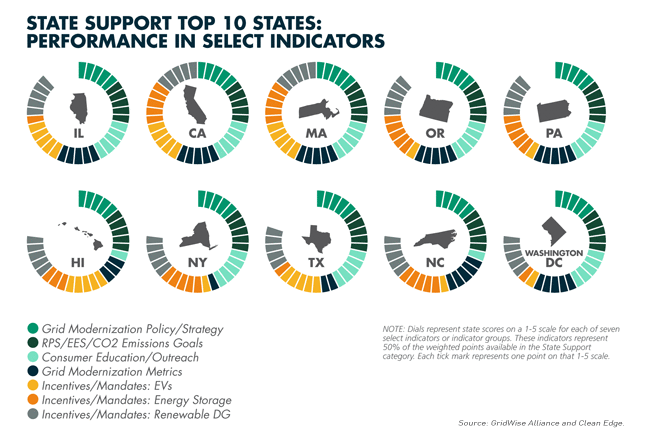 (Source: Clean Edge) 4. PURPA has been a cornerstone in the solar market, but watch out for potential attacks. The Federal Public Utility Regulatory Act, otherwise known by the attractive sounding acronym PURPA, far preceded the solar industry as we know it today. Dating back to 1978, this policy lay relatively dormant for many years before becoming a key driver of growth in small utility-scale markets in many states. North Carolina can attribute its high ranking in terms of operating solar capacity - #3 as of 2015 - in great part due to PURPA projects, also known as qualified facilities (QFs). For years, this had been perhaps the best example of a market with low policy risk because the law mandates that utilities purchase electricity from small-scale generators at (or close to) their avoided costs. Developers could count on relatively predictable PPA rates and terms for their projects, which smoothed the way for scaling development and investment quickly. Many very successful developers got their start in these markets, and many investors could deploy large amounts of capital into portfolios of essentially identical projects, thereby reducing transaction and financing costs. But recently, many utilities in many states -- here’s to you North Carolina, Montana, Utah, and Oregon, among others -- have made efforts to slow activity in the PURPA market. Before you get your hackles up, let’s pause for second to consider how woefully unprepared many utilities were for the onslaught of QF development activity once solar costs dropped low enough to have projects pencil for investors. It is not altogether unreasonable that the PURPA market be reconsidered, as it might not be serving the purpose for which it was originally intended. That said, the disruptive tactics being used by utilities to cool the PURPA market have created a contentious environment. The risk and uncertainty surrounding the future of this market has undermined years of effort and investment on the part of developers and investors. 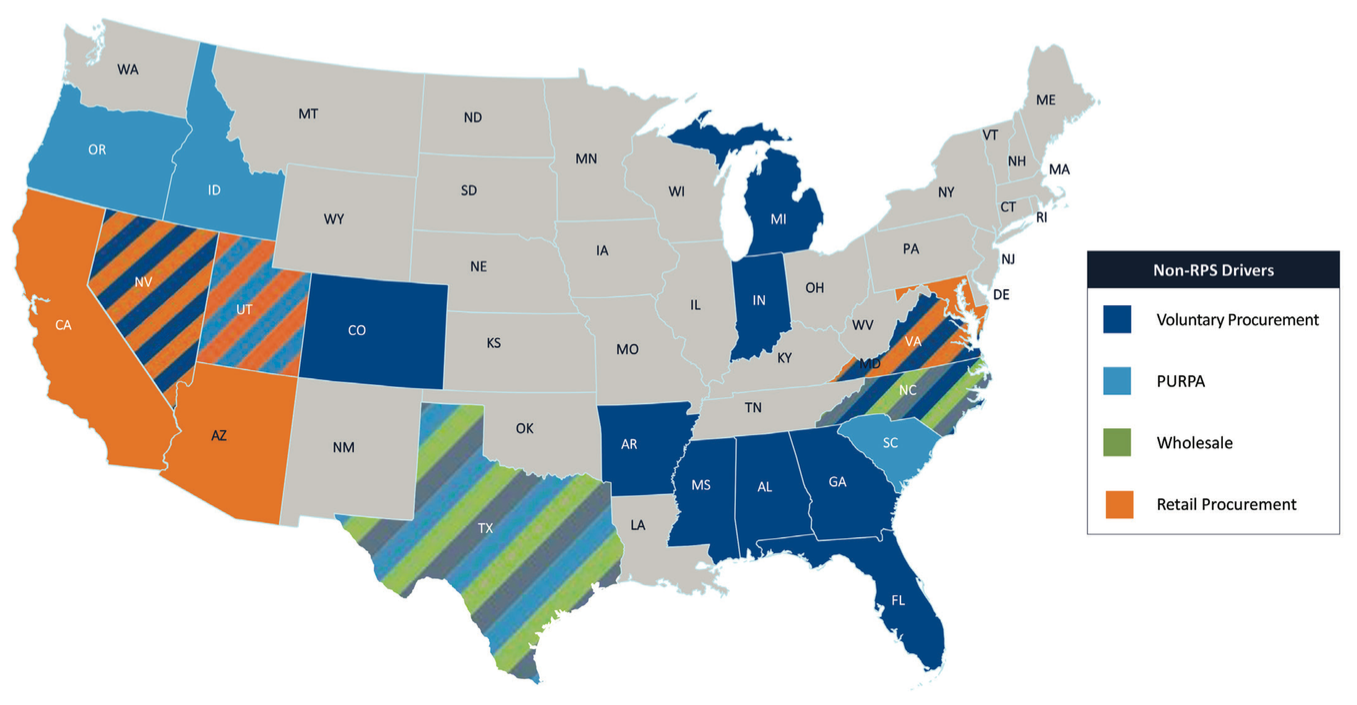 (Source: GreenTech Media) 5. Is solar ready to wean its from the ITC? The time might be sooner than you think. Lest you thought that I was going to skip over perhaps the most important incentive in the solar industry, here are my two cents on the ITC. First of all, weren’t we just here? I recall at the end of 2015 all the consternation over whether the ITC would be extended beyond 2016. We poured over what-if scenarios like the one from BNEF below. We were all in store for a blitz to the ITC finish line at the end of 2016, and, lo and behold, Congress passed an extension just before holidays. That led to some interesting dynamics in 2016, as some solar development that was slated for 2016 ended up being pushed into the future. But, all in all, the solar industry thrived in 2016, and business-as-usual was the expectation through the early 2020s. Given the proliferation of fossil fuel industry proponents and climate skeptics entering the new administration touting the “all of the above” energy strategy as their cornerstone approach, it does call to question whether the ITC is as safe as we thought it was just a short time ago. On the one hand, the solar industry has, with notable success, achieved bipartisan support from the bluest to the reddest states. Solar job creation is an unadulteratedly positive story that few can dispute. On the other hand, there are many Republicans that would love to cut government subsidies of all kinds, regardless of the public good that they might provide. Moreover, there is some momentum behind the idea of a large tax reform, which might lead to a reconsideration of the ITC, among many other tax-related subsidies. Is the solar industry strong enough to survive without the ITC? Clearly, yes. But not everyone, and not all markets. There are many investors who would not lament the elimination of tax equity from the capital stack. But make no mistake, it would be a rude awakening to abruptly end the ITC. I would not put my money on that happening. The cost is modest and there is a sunset clause already in the policy to limit long-term government liabilities. But I cannot, in good faith, make any strong predictions, so be prepared for anything. 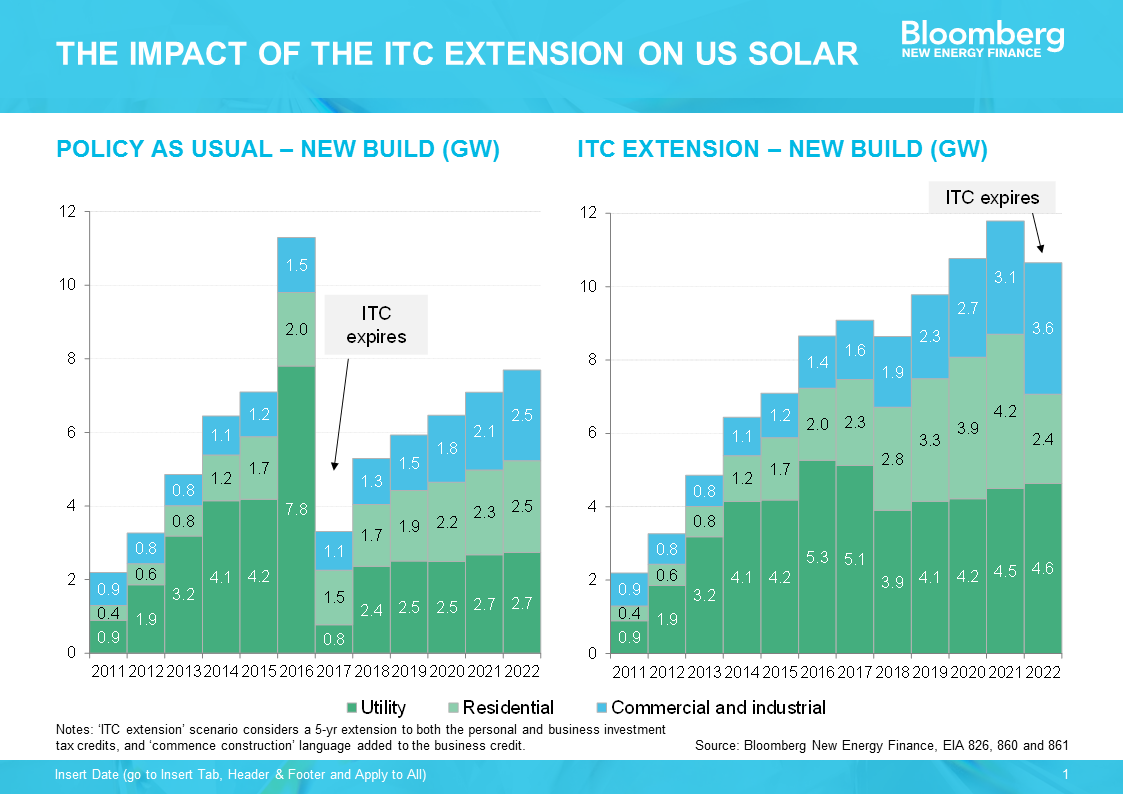 (Source: BNEF)
1. Growth in solar is pushing costs down the virtuous path of technological learning If you consume any media or analysis on the solar market, you have undoubtedly seen many graphs like the one below. That sweet exponential curve has driven much shift in investor attitudes about and activity in solar. It is likely a relief that you are no longer a pariah when you bring up solar at investor conferences. Solar has been one of the fastest growing sources of electricity (along with wind and natural gas) since 2010.  (Source: GTM / SEIA Solar Market Insight Reports, LBNL Database) But the real beauty in the growth of the solar market has to do with technological learning, or the predictable cost decreases that result from increasing “experience” with the technology. Most technologies exhibit the pattern displayed below. Growth in the development (or usage) of a technology unlocks a hidden treasure trove of reductions in cost, which further fuels the positive feedback loop generating more development growth. And so the march goes on. The graph below shows the reduction in the price of solar electricity, which is one measure of cost. We are going to dive into some others. The brain tickler is what the rate of cost reductions will be moving into the future. Even though solar has experienced an unexpectedly rapid reduction in costs, many predict this trend will not abate for some time. 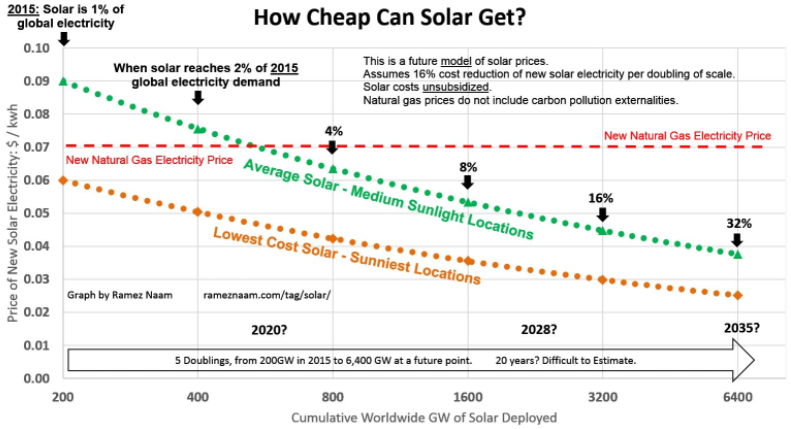 (Source: Ramez Naam) 2. Just because solar build costs are cheapest in utility-scale does not mean that is where the best risk-adjusted returns are The undiscerning investor may jump to conclusions - utility-scale solar must be the best bang for the buck because it is the cheapest. But you would be only partially right (and sometimes mostly wrong). While utility-scale solar is now consistently being installed for less than $2.00/W, this is the market where we are seeing the lowest per kWh revenues, as utilities are getting a bit less generous with their PPA terms (more on that later). But the projects are big and relatively standardized, so the investment profile is still attractive to many investors. Commercial (here referred to as non-residential) solar is a tantalizing market in that it can present an attractive investment profile, but often with some funky (e.g., heterogeneous) risk characteristics. You can find some appealing portfolios of projects above the 500 kW threshold, but there are a whole suite of idiosyncratic risks associated with the offtaker, EPC, etc. Only the brave (and smart) are wading into vast expanse of untapped opportunity in commercial solar, and with some considerable success. Watch out for the leading actors in the space. 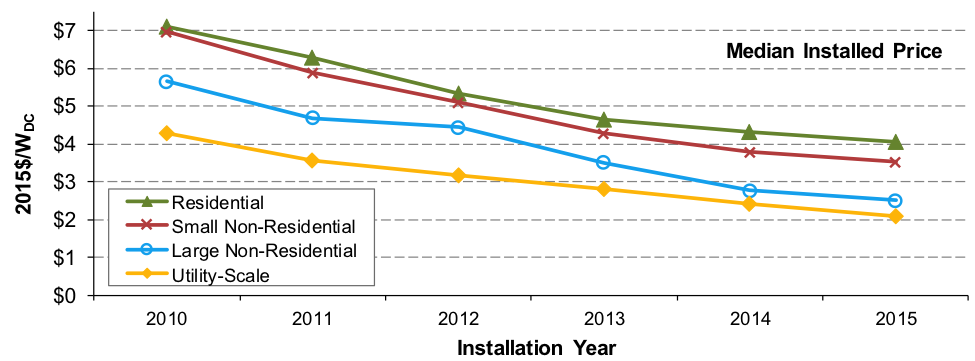 (Source: Scientific American) 3. Averages are useless - smart investors think in terms of distributions It is all too easy to think of solar as a monolithic industry, but that would be missing the story beneath the headlines. Distributions are the key to understanding market trends, and identifying areas ripe with opportunity. The graph below tells a story of market convergence. Most projects are achieving similar build cost performance over time. If you are presented with a project with all-in build costs above $3.00/W, then you either have a particularly challenging project, or a particularly challenged builder. Pick your poison. This convergence also means there is more a general sense of how to benchmark a project, and hold EPCs accountable to the standards being set by their peers. 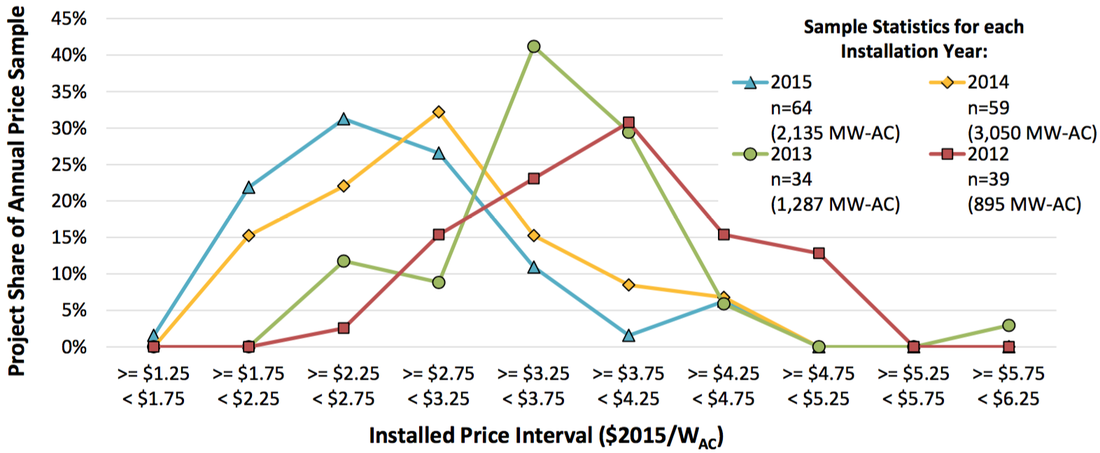 (Source: LBNL) Disclaimer: the sunniest places are not necessarily the best markets for solar. That largely is a policy driven issue, which will be a topic of another post. But sun (or insolation if you want to sound clever) can be very useful. The real takeaway from understanding geographic distributions is that capacity factors (e.g., the underlying technology performance of generating electricity) places some bookends around what sort of revenues and costs a project can support to hit your hurdle rates. The Northeast needs a bunch of incentives to have projects pencil for investors. Less so the case in sunny California or the Southwest. Developers are often inclined to slightly (or aggressively) inflate the performance of their projects. This is an easy area to push back if you have the right data at your fingertips. Remember solar negotiations 101: Don’t take the developer’s project valuation at face value. 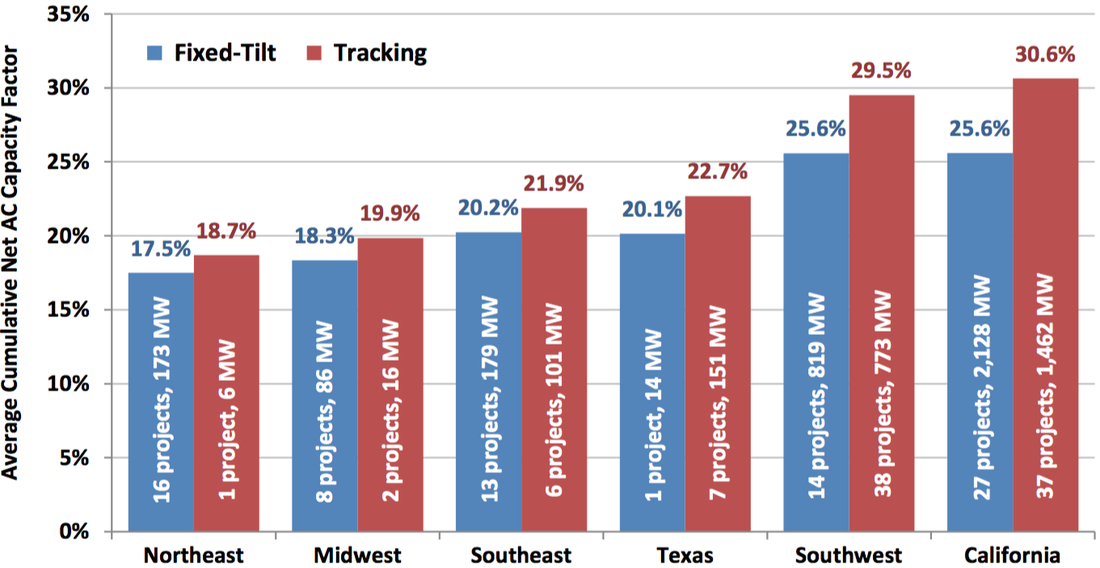 (Source: LBNL) 4. Return compression and the southern PPA migration It is often headline news when a new record low PPA rate is achieved. This is great for offtakers and utilities, but can be a source of deep consternation for investors seeking market rate returns. What is the enterprising investor to do? Utility-scale PPAs are now consistently below the $50-$60/MWh threshold, which is remarkable considering that just a decade ago, PPAs were 5x those rates. But this means that an investor that wants to compete in this market needs deep pockets and a low cost of capital. If when you look in the mirror, that is not you, then it is time for a gut check. Translation - you need to take some perceived (?) market risk. If you want to wade into a different area of the PPA pool, that means tapping to the aforementioned commercial (often referred to as C&I) market, or exploring more nascent markets such as community solar. You may be able to attract better PPAs, but they will be offset by higher per Watt build costs, O&M costs, and a different risk profile. This means a different underwriting and due diligence process that can cascade into high transaction costs for the unprepared. Choose your battles. 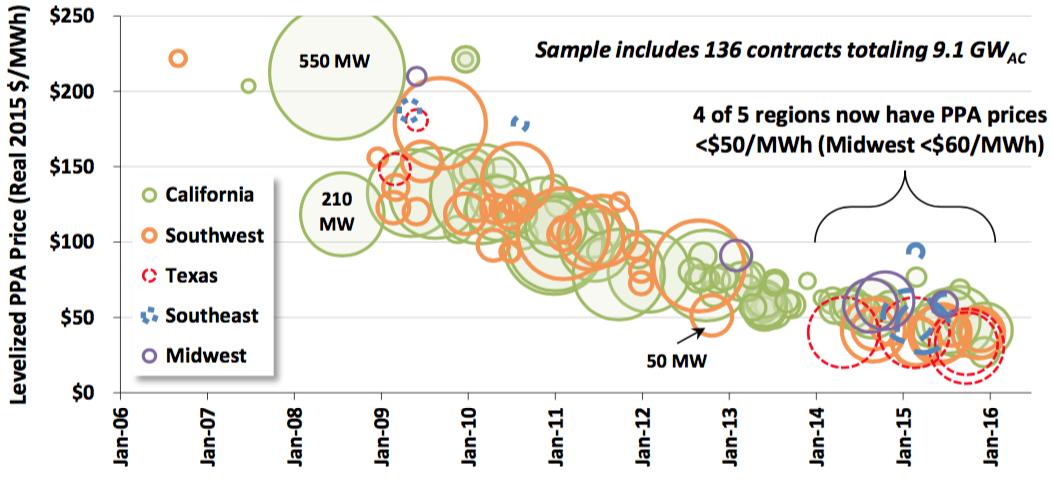 (Source: LBNL) 5. Don’t forget that solar projects are long-term operating assets. Investors should be riding the downward trend in OpEx to boost returns, especially on the back-end. One unmitigated piece of good news for investors is that O&M costs are also trending downward, now below $15/kW-yr. These often underappreciated components of any project cost profile are a key to unlocking longer-term value. Many investors often neglect to put the time and effort needed to manage OpEx costs to optimize returns, especially on the back-end of an asset’s lifespan. If you pay more attention in structuring asset management, O&M, insurance, and other OpEx contracts, the ROI will be, let’s just say, highly justified. O&M Costs 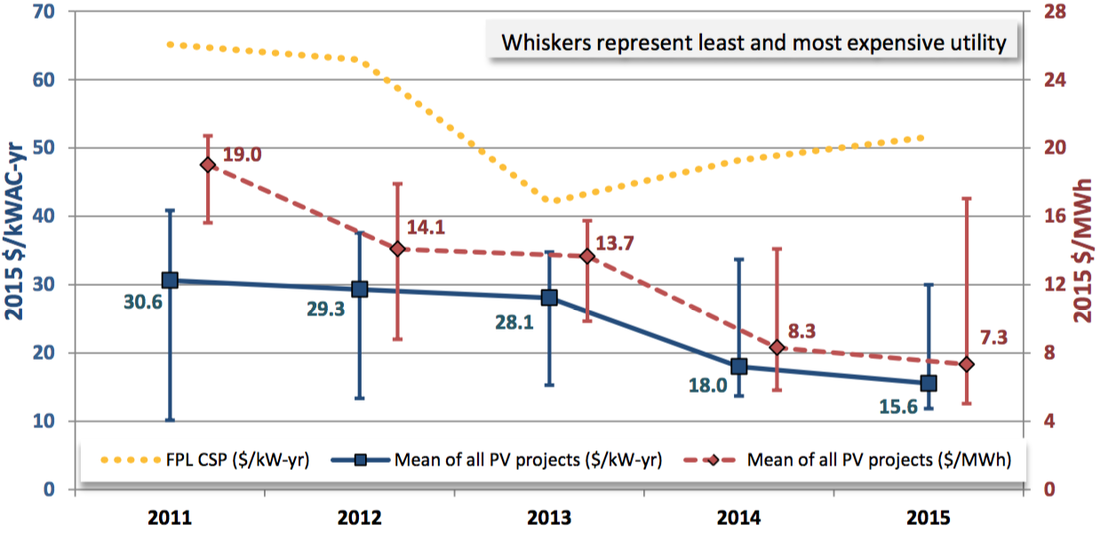 (Source: LBNL)
1. Growth in global solar development has not stalled, despite the 8% decline projected for 2017 Global solar development is projected to grow a remarkable 48% compared to 2015, reaching 76 GW installed by the end of 2016, according to Mercon Capital Group. We in the U.S. cannot claim all of the credit. It appears as though record-level solar development in China is largely responsible for this growth. But when you look at 2017, investors start to become very wary. Exponential growth from 2.6 GW to 76 GW in 10 years (40% CAGR), followed by a projected 8% decline in 2017! What gives? Well, again the story is about China, which is expecting a steep decline as a result of anticipated tariff cuts and reduced national targets following the solar module oversupply that fueled the 2016 growth. In the U.S, we are expected to stay steady after a 70% spike in solar development in 2016. But let’s not sleep on Japan (still a vibrant market) and India (emerging as a real contender). 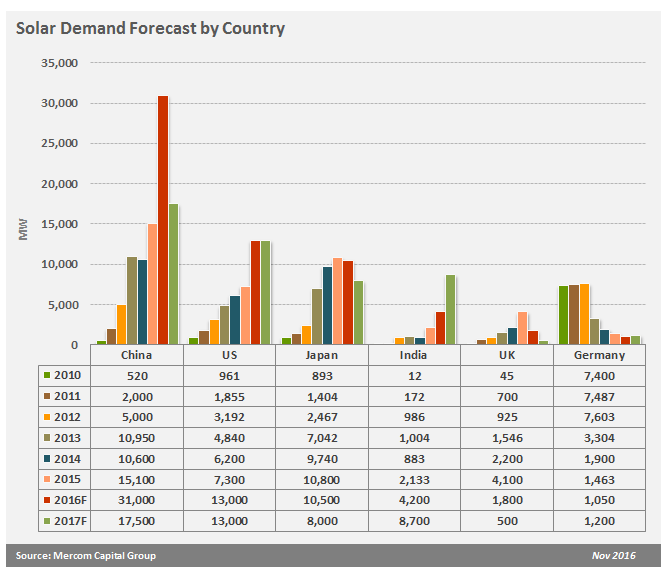 (Source: Solar Industry Magazine) 2. Don’t get too concerned about fluctuating solar stock prices -- remember the long game Public markets are fickle. And remember stocks are valued (theoretically) in terms of future projected cash flows. Which means it is all about expectations. Right now, many investors feel there is a bear market lurking around the corner, and the SunEdison debacle has done little to assuage the public’s concern about the solar industry. The big name market barometers are sending signals to be very worried about the long-term prospects of the solar industry. SunPower (SPWR), First Solar (FLSR), and Canadian Solar (CSIQ) are all taking a nosedive. Yieldcos -- Pattern Energy (PEGI), 8point3 Energy Partners (CAFD), and the much beleaguered Terraform Power (TERP) -- are also all trending down after a comeback from last summer’s downturn. Two things are dragging down stock prices - persistent low module costs putting a downward pressure on revenues and over-leverage eroding cash flows. Only the companies with the financial agility to continue to generate positive cash flows will weather the price wars, but the solar industry as a whole with weather this period successfully. 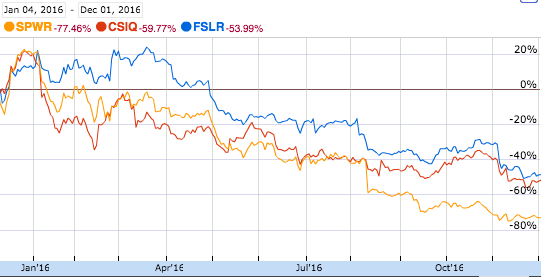 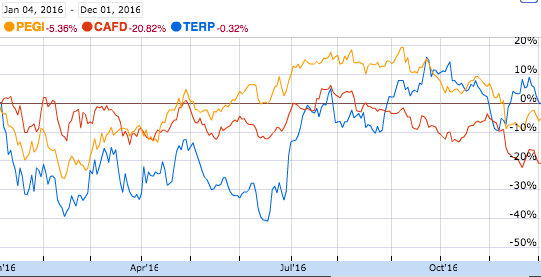 (Source: Google Finance) 3. 83 companies committed to 100% renewable, but just wait for the prosumer revolution According to RE100, some of the largest corporations in the world are aiming to get to 100% renewables. Some of the usual suspects are from the tech world -- Apple, Facebook, Google. But you might be surprised to find old school corporate behemoths such as WalMart, Nike, Johnson & Johnson, Proctor & Gamble, and the Tata group have joined the ranks, as well. Now, all of that will not be solar, but a lot of it will. Solar affords the corporate investor a lot more flexibility in the project size and location, lower basis risk, and better synchronicity with peak demand. Corporate power purchasing grew to 3.23 GW in 2015 (Source: RMI), and is only expected to grow more, especially as virtual net metering and community solar policies allow for more off-site solar solutions. Watch out for some of these companies to cross into the ranks of “prosumers,” companies that both produce and consume energy. Apple recently filed for licenses in California, Oregon, and Nevada to sell its excess electricity directly to consumers (Source: HBR). This really could be a gamechanger. 4. Solar investors flock south to Latin America, even as returns head in the same direction It is not headline news that Latin America is becoming an attractive area for investment in solar. The region is expected to grow at an annual rate of 40% through 2021 after all, with Mexico, Chile, and Argentina leading the charge. Amid the many interesting facets of solar development and investment in Latin America -- transmission constraints, locational variability in price, currency and credit risk, new renewable energy mandates and policies, etc. -- the real braintickler is how are all of the auctions going to play out over time. Auctions have consistently returned remarkably low prices - $45/MWh in Mexico, $29/MWh in Chile, and $59/MWh in Argentina. With falling solar module prices, there is some room for developers to deliver projects that can meet investor hurdle rates at those prices. But the competition is tough, and some investors have grown wary of playing the auction game. All the while, do not forget about Central America and the Caribbean. El Salvador and Honduras, among others, are paving the way for solar expansion with a range of promising utility-scale projects.  (Sources: GTM) 5. Community solar is the real anti-establishment energy choice Even though SunRun wants you to think that “roof-top solar is the anti-establishment energy choice” (Source: GTM), it is not a choice available to nearly half of all U.S. households. Enter community solar, the renewable energy choice for the masses, including the often forgotten low- to medium-income households. The benefits to offtakers are obvious -- access to clean, reliable electricity from solar farms built at a much lower cost than their roof-top solar siblings ($2.00-$2.50/W vs. $3.00-$3.50/W). And based on a simple savings-to-investment ratio, 35-48 states are attractive locations for community solar. No wonder NREL projects that community solar will make up half the distributed generation market by 2020 (Source: NREL). Once investors can get comfortable underwriting the somewhat unique risks of community solar projects, there will likely be a fairly attractive risk-return profile and a largely untapped market if and where policy falls in line. 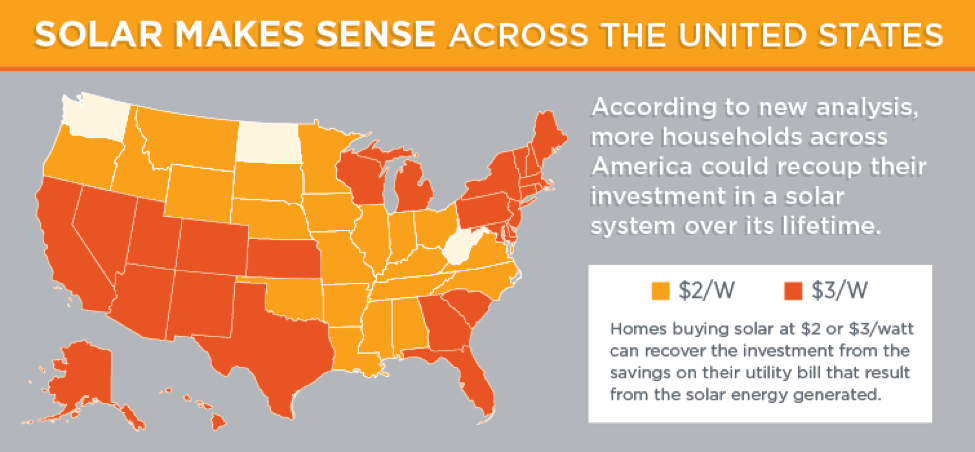 (Source: DOE Office of Energy Efficiency & Renewable Energy)
Postscript. Elephant in the room -- No one knows what the Trump era holds for solar Policy support at the federal level, most notably the ITC, has been essential in accelerating the growth and maturation of the solar industry. The ITC appears safe for the moment, but may end up on the chopping block in a larger tax reform bill. Nobody knows. What we do know is that the solar industry is here to stay, federal incentives or not. The value propositions for solar -- clean and affordable source of electricity, economic development and job creation, and attractive investment opportunities -- are not going to change. There may be bumps in the road if the federal government attempts to resuscitate the coal industry at the expense of support for renewables, but the industry will navigate them and move on. Coal's downward spiral is unlikely to be something that Trump can avert despite his grandiose promises (Source: Yale Environment 360). I’ll leave you with one heartening statistic - there are more clean energy jobs in the state of Ohio than there are coal industry jobs in the entire U.S. (Source: Renewable Energy World). If President-elect Trump holds to his promise to focus on job creation, the answer should be clear for all to see. 11/18/2016 The Mainstreaming of Renewable Energy Infrastructure Investing - Risks, Returns and Emerging SectorsRead Now If you work in renewable energy or infrastructure finance, then you might like this... Yesterday, I published an article in the Real Assets Newsletter for Preqin, a global leader in market intelligence for the alternative assets investment industry, serving 40,000 investment professionals in 90 countries. See the link below. It's on page 8. "The Mainstreaming of Renewable Energy Infrastructure Investing - Risks, Returns and Emerging Sectors"  Here are two highlights... Figure 1 shows the attractive risk-return of infrastructure vs. other asset classes. Note that renewable energy made up 54% of all infrastructure deals globally in Q3 2016. 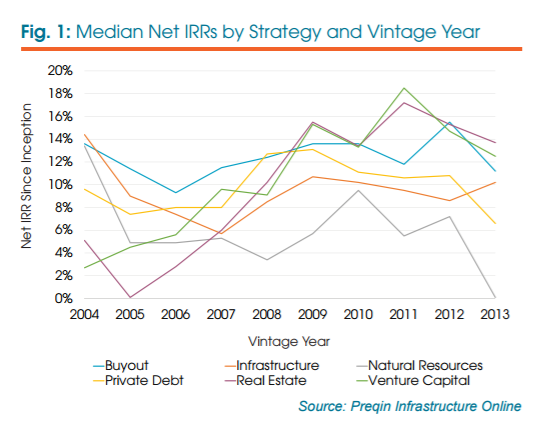 Figure 2 illustrates that solar projects in the developing world tend to be larger (i.e., allow for greater volumes of capital allocation) and generate higher IRRs (albeit with more political and other country risks). 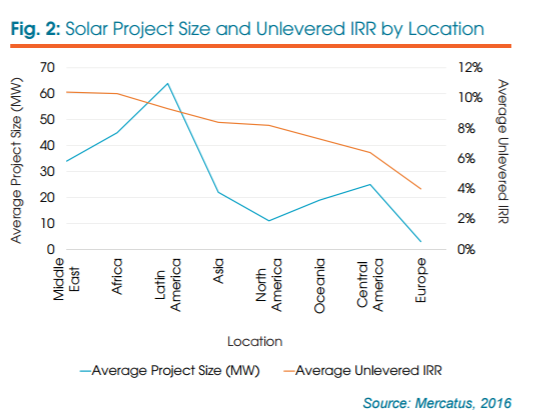 What does it all mean for investors? It's time to look forward, not backward. Most perceptions about renewable energy are outdated because the sector is changing so quickly. Those wait run the risk of being late to the (raging) party.  You’ve seen many headlines touting “record new solar panel efficiency.” We get excited seeing those, too. But they don’t matter. Alright, that was shock value. Let me explain. First, take a gander at the mind-numbing chart from the US National Renewable Energy Lab (NREL) below. This is one of my favorite figures in the whole world. Now, please memorize it -- there will be a quiz later. (Or so I tell my corporate and military executive students. They laugh at my false threats.) What does this figure say to you? 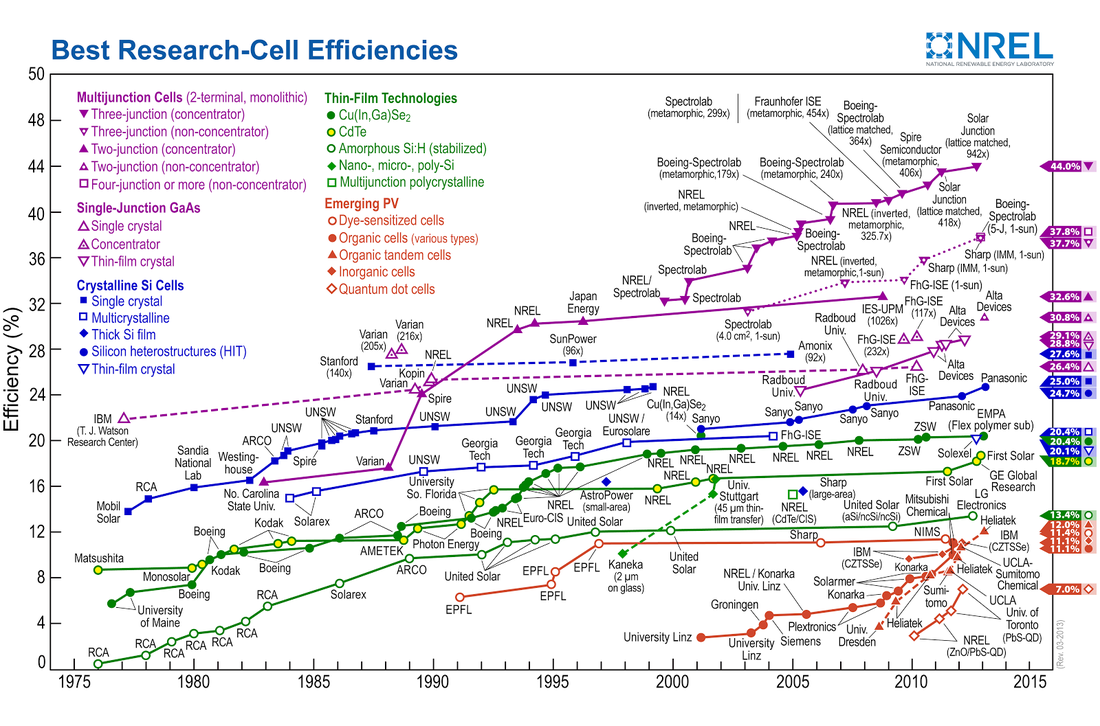 Three potential takeaways: 1. There are way more types of solar panels than you thought, right? 2. Solar panel efficiencies have improved considerably between 1975 and 2015. Duh. 3. The guys doing the stuff in red font should get new jobs given their low efficiency. (Not really. Those are super cheap organic polymer-based solar cells. Their future will come one day.) OK. Now forget that graph. Look at these two more important charts from Bloomberg.  Do you see any relationship between these the red and blue lines? (I hope you do.) Cost falls. Solar installations go up. And now for the next chart.  Yes, you are reading that right. A 99% drop in solar panel prices since 1976. I know, I know. I hear the devil’s advocate: But doesn’t greater volume of solar installations drive down costs? Yep, but the opposite is more true. Cost drives volume. China got in the manufacturing game just as the recession of 2008 hit and EU solar demand fell off. Solar panel prices fell faster and haven’t really stopped, resulting in an 80% drop prices in the last 8 years. For more data and graphs about solar's falling costs and coming world domination (insert dramatic music), see energy rockstar Joe Romm's piece "You’ll Never Believe How Cheap New Solar Power Is." In case you fear that my ponytail is getting in the way of my PhD and love of private equity (insert humor), and that I'm being too kind to solar, consider this projection from Bloomberg: By 2040, global investment in solar will total $3.4 trillion, while fossil fuels and new nuclear will only receive $2.1 trillion and $1.1 trillion, respectively. One word: Yikes. So what? The next time you hear a sales pitch about panel efficiency, praise them for their ingenuity. They are real wizards. But just keep asking: What is the resulting $/kwh and Internal Rate of Return of the solar project? Efficiency is the finger point at the moon. Please go after the moon. Amid the buzz of Solar Power International 2016 last week, there was a persistent cry of the financing gap in C&I solar. Yes, big money is flooding in searching for good projects to finance. The low-hanging fruit has always been utility-scale solar. Scale, credit-rated offtaker, stable cash flows - check. But margins are being squeezed as the race to bottom out PPA prices builds momentum. Enter C&I solar - a tantalizing large potential market of smaller-scale projects, trending towards 3rd party ownership (translation = welcome investors!), with low hanging fruit ripe for the picking. Commercial and industrial offtakers seem more willing than ever to sign up for solar, and at PPA rates often substantially higher than what can be gotten from our utility friends. But, is C&I solar the greenfield opportunity that many hope it to be? 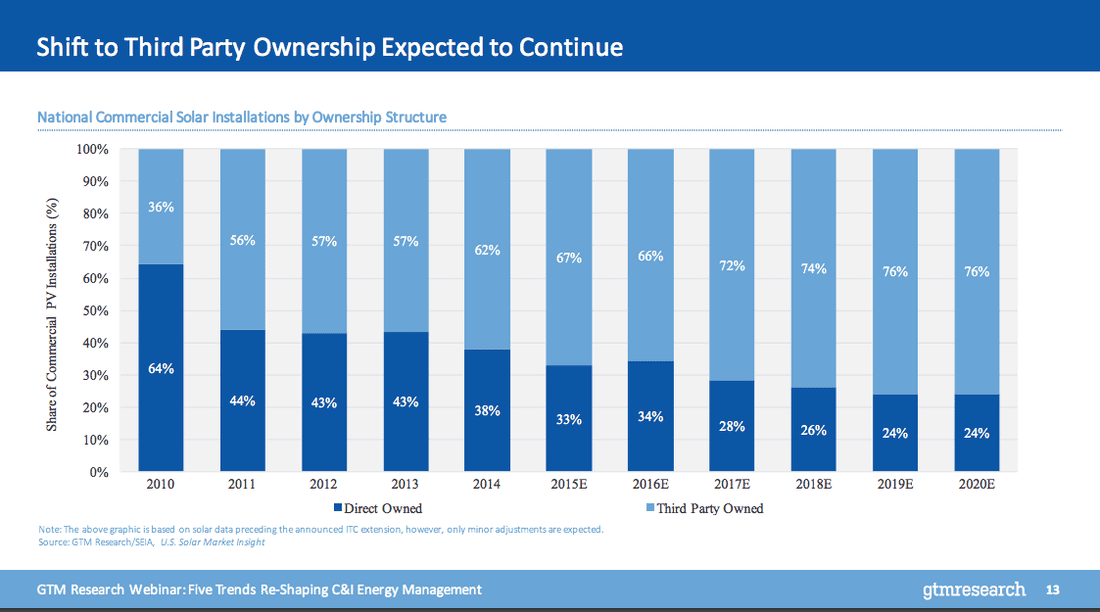 (Source: GreenTech Media) C&I solar is not blessed with the same attributes as a utility-scale project - smaller scale, offakers with no credit ratings, and, most importantly, extreme heterogeneity. Diversity is every infrastructure financier’s nightmare, as it stymies standardization, which is the key ingredient to scaling investment from more risk-averse, low cost of capital investors. And the C&I solar market has bedeviled many attempts to solve the standardization challenge. By way of example, I am going to pick on beEdison and their flagship risk analytics product, truSolar. TruSolar, a project cofounded by Distributed Sun, Dupont, RMI, and Underwriters Laboratories, was an attempt to create a uniform method for assessing project risk in C&I solar. The truSolar Risk Screen Criteria and Methodology (RSCM) identified over 800 unique risk elements and thousands of scoring dependencies. Impressive? Or overkill? Hard to say. On top of this great risk analytics tool, they created a marketplace platform, used a ton of project data to train their risk algorithms, created nifty flow charts like the one below, and hoped that buyers and sellers would seek holy matrimony at their table. By all accounts, truSolar is the real deal, and who doesn’t like marketplaces, but are buyers and sellers coming? They built it, so did they come? beEdison claims to have 200 members and 1,000+ projects totally over 4 GW and $10B of dealflow. But, I have to admit - I am skeptical. Around 2 GW of solar was developed in Q2 2016, and less than 20% of that was in C&I market (SEIA). So, it appears as though the 4 GW number is just maybe a bit of an overstatement.  (Source: beEdison)
To be sure, I am fan of beEdison’s approach. It is ambitious, and it solves a real challenge in the solar C&I market using - everyone’s favorite buzzword - BIG DATA! So, why is it not sweeping through the marketplace with wild abandon? Perhaps, they made the risk analytics process too opaque and complex. Perhaps, sellers do not trust the idea of using a platform to meet sellers, or vice versa. Or, perhaps the real issue is that solar C&I projects are not penciling like investors would hope. The real challenge in the solar C&I market is not just standardization and credit analysis. It is that these projects do not turn out to be nearly as rich as investors had hoped. It is a classic case of failing to achieve economies of scale. Development and construction cost efficiencies in the utility solar market allow projects to pencil even with really low PPA rates. It is really difficult to translate those cost efficiencies into the C&I solar market due to the aforementioned issue of extreme heterogeneity. Said another way, solar C&I projects just cost more. And only in niche markets can those high project costs be supported by the prevailing PPA rates that a C&I customer will accept. Many geographies are blessed with low retail electricity rates, especially for large electricity users. These offtakers are not likely to accept a PPA which locks them into a higher electricity cost today, even if the long-term impact will likely be in their favor. When high development and construction costs run up against this ceiling of acceptable PPA rates, you start to see margins squeezed. But the difference is that these margins are on small projects with funky risk profiles. So for the time being, solar C&I remains a “diamond in the rough” market. Investors are seeking the gems out there, while many (I mean, many) projects out there just fail to meet their hurdle rates, risky or not. But be on the watch - there are many other companies exploring ways to serve this sector efficiently, and at scale. The real gamechanger may not be nifty platforms, but rather the tried and true method of securitization. Solar securitizations are happening, pioneered by SolarCity and SunRun, but can the question remains as to whether they can open the floodgates of institutional capital given the fragmented and idiosyncratic nature of solar C&I projects. Nobody likes paying more than they should. And my dad is a CPA, so this is definitely true for me, too. But this barrier is not unique to renewable electricity. The same expectation is true for most non-luxury goods and services. Yet I still hear the objections everywhere -- from sophisticated investors to family friends -- that solar and wind are too expensive. Is that still true? Yes, but increasingly no. OK, to be clear, most of the data says no, but as you know, perception is reality. This lingering misperception is also being observed by other energy leaders, including the Director of Sustainability and Cleantech at Schneider Electric in recent a Greentech Media article about Scheider’s New Energy Opportunities (NEO) Network. Consider the graph below from Clean Edge, which is based on data from the US Lawrence Berkeley National Laboratory. The levelized costs for solar electricity (LCOE) has fallen from 22.5 c/kwh to less than 5 c/kwh. That’s a roughly 78% drop in price over the last 10 years. But unless an investor or corporate executive has regularly re-evaluated the business case for alternative energy, they might have missed these market changes. 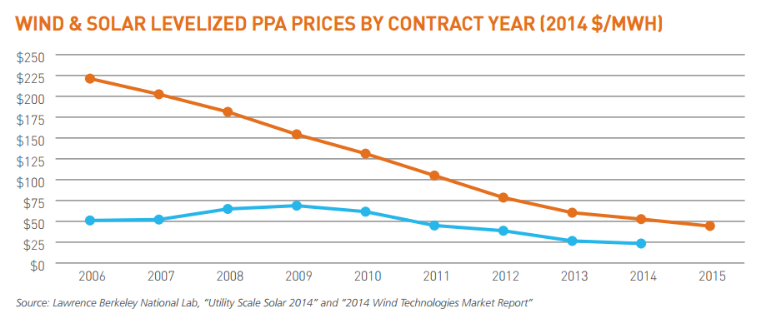 It’s important to note that this refers to utility-scale solar, not rooftop solar. The latter has a higher LCOE (c/kwh), but it also competes with higher retail electricity rates. Additionally, Deutsche Bank estimates that unsubsidized rooftop solar is 30% cheaper than retail power prices in many countries. See their map below showing countries with substantial areas of grid parity. 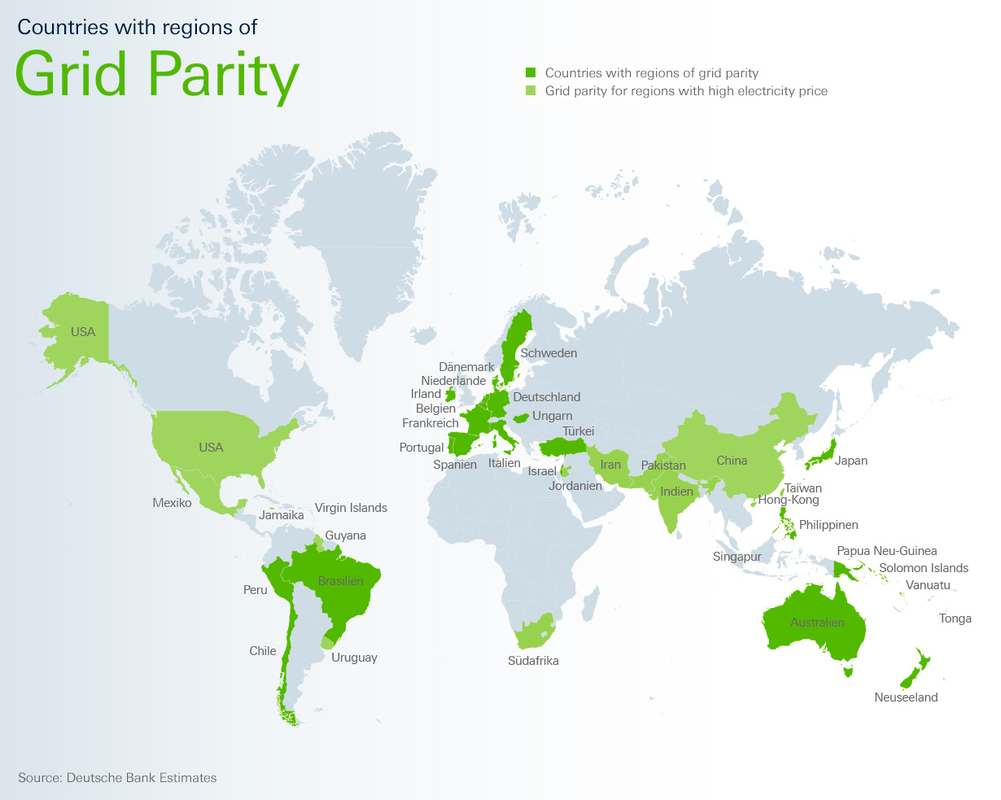 Finally, here’s another data-driven perspective from investment advisory firm, Lazard. The resolution is not great, so let me help you out. Here are some of the lowest LCOE values from highest to lowest:
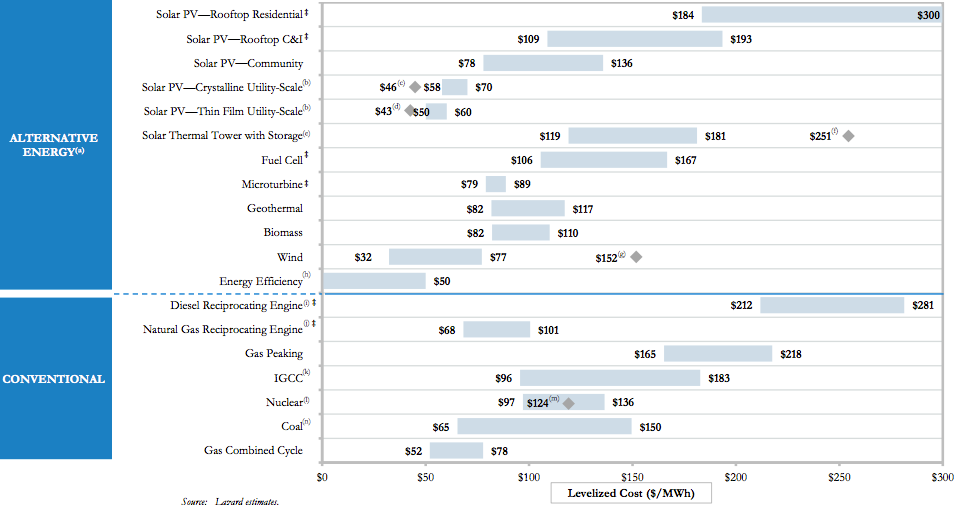 Here’s a link to the full Lazard report, version 9.0.
If you like data and charts, you’re going to really enjoy this. Grab a big coffee and settle in for some quant goodness. And next time someone says that solar is too expensive, you can admit they are partially right. But then give them a little dose of 2016 data. Does every solar project have to be big? Many solar investors’ intuition rests easy when they see the graph below. It fits into the elegant framework of “economies of scale.” The bigger the project, the lower unit cost of installation. The smaller the project, more cost-inefficient. Going big is part and parcel with cost efficiency, or so the saying goes. 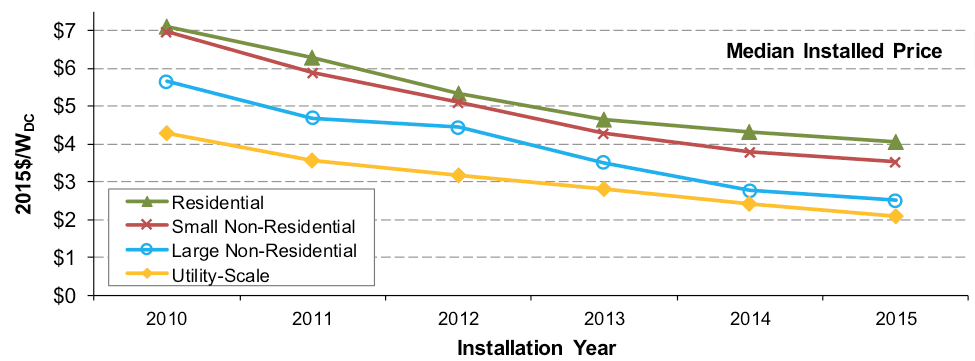 (Source: Lawrence Berkeley National Laboratory) But be careful, this is precisely the rationale used to advocate that utility-scale solar is the only form of solar in which we, as a society, should be investing. Heck, Warren Buffett believes so, and that guy never makes a bad bet (at least publicly). Why produce electricity from projects that can be built at $4/MW on top of a house, when you can generate those same electrons from a larger project that can be built for half the cost? It is a compelling argument, I must admit. But it suffers from the same “big infrastructure” fallacy that is currently hamstringing our legacy centralized energy system. Build BIG projects for cheap on a per MW basis. Big is cheap and efficient. But, as any good economist knows, external costs can cause headaches (and asthma, skin cancer… you get my drift). Utility-scale projects have gotten a free ride See, BIG projects are cheap, in part, because they burden society with costs not borne by the projects themselves. What costs you might say -- only the never-ending litany of transmission and distribution expenditures. Billions of dollars of deferred T&D expenditures hang like a dark cloud over electric sector. And who is paying for those? Not the project owner, that is for sure. Yes, there are interconnection costs, but let’s be real, they hardly cover it. That is not to say that there is not, in fact, a significant need for big projects. But only to a certain extent. Why only build projects that necessitate that we continue to invest so heavily and T&D infrastructure? Small can be beautiful (and efficient), too. Yes, we should invest in more high voltage DC transmission. But, why not minimize the need for such costly investments by building smaller C&I and residential projects? They may be more costly on paper, but at the scale of the whole grid, they may actually be introduce some much needed cost-cutting. Thus, it is the prospect of avoided T&D costs that gives any credence to the claim that smaller-scale projects can be both both prudent and cost-efficient. Avoided costs is a common concept in utility-scale generation, but, for some reason, this logic is not applied to smaller-scale projects. It is not because they don’t make sense, it is because utilities are uncomfortable with power producers that they do not control. Investors start to take notice of smaller-scale solar Now, from the perspective of an investor looking to be a long-term project owner, things get interesting. The graph below show the slow march down the path of PPA price decline. 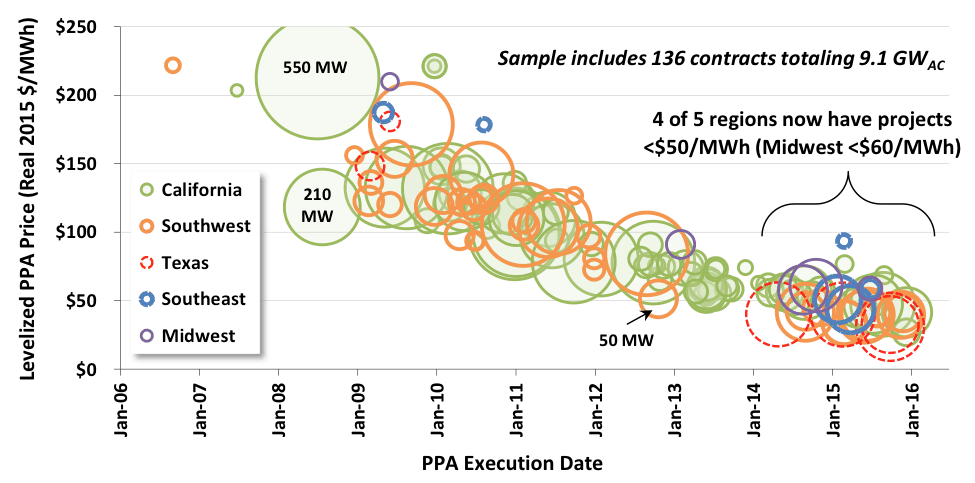 (Source: Lawrence Berkeley National Laboratory)
On the one hand, great - solar power is getting cheaper, and fast! On the other, there is a palpable sense that there is large-scale suppression of investors returns taking place. Fair enough. Once a market matures, actual or perceived technological risk reduces, and returns should decrease. But that does not stop investors from feeling the squeeze. And that squeeze is happening particularly in the utility-scale market. In part because utilities have a lot of negotiating power in many markets, PPA prices are plummeting, some creeping below the $0.04/kWh threshold. There is still value to be had, but the pressure to find good deals has encouraged (ahem… forced) investors to look back into the C&I market for the returns they seek. This is great from the standpoint of increasing access to capital for a market segment which historically has been more difficult to finance. Less standardized and smaller projects, diverse off-takers, many without credit ratings, and less financially robust developers have all hampered the expansion of C&I solar. But, now the suppression of utility-scale solar returns has led investors to start poking around the sleeping giant of C&I solar. Many C&I off-takers have the ability and willingness to pay much higher PPA rates than utilities. Translation = sweet returns. And, there are a LOT of them. If you are lucky enough to find them in places like Nevada where many large-scale C&I customers have been summarily pissed off by the antagonistic treatment by the utilities commission, then you could make some big waves. And, as C&I developers have become more sophisticated, projects are trending towards more consistency, bankability, and less risk. So, keep a lookout as the C&I solar market starts to find that sweet spot in the classic risk vs. return story. Small can be beautiful in the solar market. Nobody likes paying more than they should. And my dad is a CPA, so this is definitely true for me, too. But this barrier is not unique to renewable electricity. The same expectation is true for most non-luxury goods and services. Yet I still hear the objections everywhere -- from sophisticated investors to family friends -- that solar and wind are too expensive. Is that still true? Yes, but increasingly no. OK, to be clear, most of the data says no, but as you know, perception is reality. This lingering misperception is also being observed by other energy leaders, including the Director of Sustainability and Cleantech at Schneider Electric in recent a Greentech Media article about Scheider’s New Energy Opportunities (NEO) Network. Consider the graph below from Clean Edge, which is based on data from the US Lawrence Berkeley National Laboratory. The levelized costs for solar electricity (LCOE) has fallen from 22.5 c/kwh to less than 5 c/kwh. That’s a roughly 78% drop in price over the last 10 years. But unless an investor or corporate executive has regularly re-evaluated the business case for alternative energy, they might have missed these market changes.  It’s important to note that this refers to utility-scale solar, not rooftop solar. The latter has a higher LCOE (c/kwh), but it also competes with higher retail electricity rates. Additionally, Deutsche Bank estimates that unsubsidized rooftop solar is 30% cheaper than retail power prices in many countries. See their map below showing countries with substantial areas of grid parity. Finally, here’s another data-driven perspective from investment advisory firm, Lazard. The resolution is not great, so let me help you out. Here are some of the lowest LCOE values from highest to lowest:
Here’s a link to the full Lazard report, version 9.0.
If you like data and charts, you’re going to really enjoy this. Grab a big coffee and settle in for some quant goodness. And next time someone says that solar is too expensive, you can admit they are partially right. But then give them a little dose of 2016 data. You’ve seen many headlines touting “record new solar panel efficiency.” We get excited seeing those, too. But they don’t matter. Alright, that was shock value. Let me explain. First, take a gander at the mind-numbing chart from the US National Renewable Energy Lab (NREL) below. This is one of my favorite figures in the whole world. Now, please memorize it -- there will be a quiz later. (Or so I tell my corporate and military executive students. They laugh at my false threats.) What does this figure say to you? 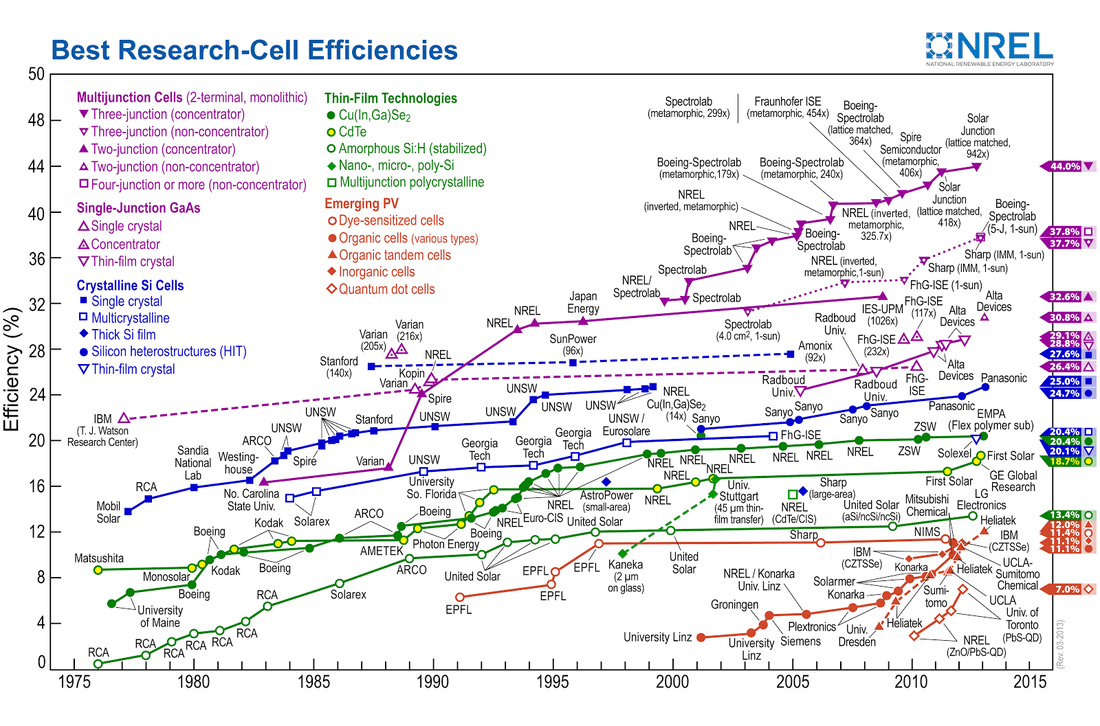 Three potential takeaways: 1. There are way more types of solar panels than you thought, right? 2. Solar panel efficiencies have improved considerably between 1975 and 2015. Duh. 3. The guys doing the stuff in red font should get new jobs given their low efficiency. (Not really. Those are super cheap organic polymer-based solar cells. Their future will come one day.) OK. Now forget that graph. Look at these two more important charts from Bloomberg. 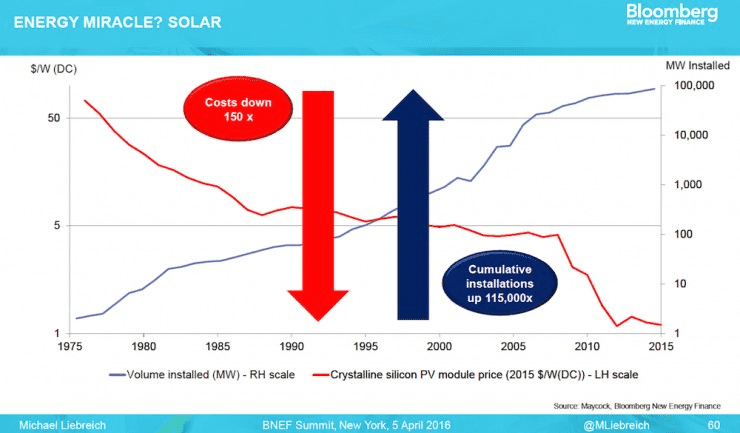 Do you see any relationship between these the red and blue lines? (I hope you do.) Cost falls. Solar installations go up. And now for the next chart. 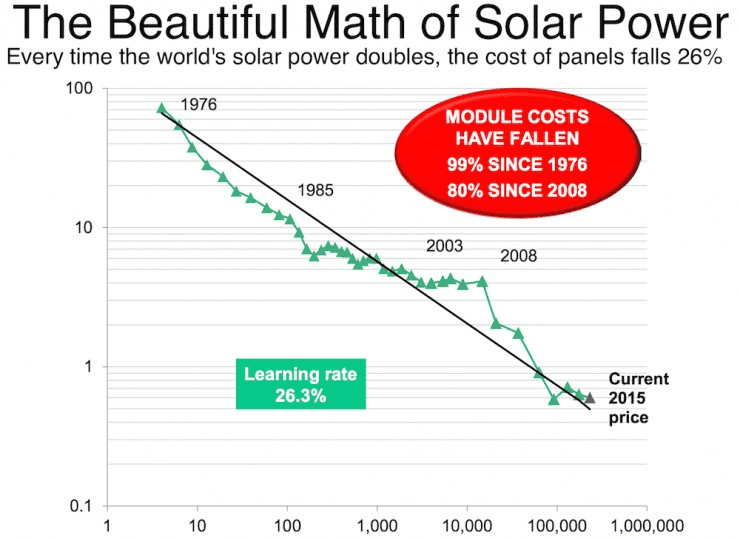 Yes, you are reading that right. A 99% drop in solar panel prices since 1976.
I know, I know. I hear the devil’s advocate: But doesn’t greater volume of solar installations drive down costs? Yep, but the opposite is more true. Cost drives volume. China got in the manufacturing game just as the recession of 2008 hit and EU solar demand fell off. Solar panel prices fell faster and haven’t really stopped, resulting in an 80% drop prices in the last 8 years. For more data and graphs about solar's falling costs and coming world domination (insert dramatic music), see energy rockstar Joe Romm's piece "You’ll Never Believe How Cheap New Solar Power Is." In case you fear that my ponytail is getting in the way of my PhD and love of private equity (insert humor), and that I'm being too kind to solar, consider this projection from Bloomberg: By 2040, global investment in solar will total $3.4 trillion, while fossil fuels and new nuclear will only receive $2.1 trillion and $1.1 trillion, respectively. One word: Yikes. So what? The next time you hear a sales pitch about panel efficiency, praise them for their ingenuity. They are real wizards. But just keep asking: What is the resulting $/kwh and Internal Rate of Return of the solar project? Efficiency is the finger point at the moon. Please go after the moon. 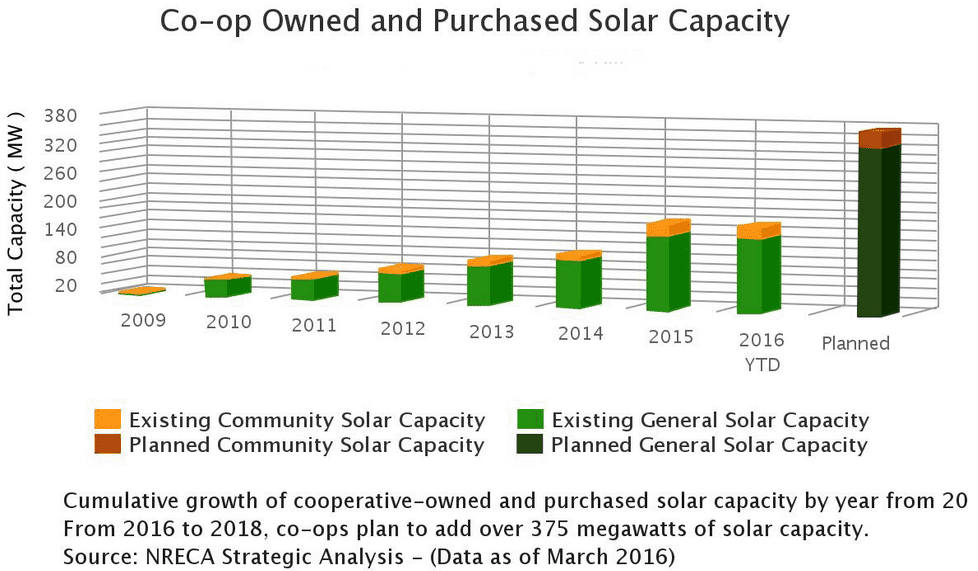 (Source: GreenTech Media)
Co-ops and munis finally get a spot at the clean energy table In the energy industry, utilities have long run the show. The transition to clean energy is undercutting utilities’ historical dominance of how electricity generation, transmission, and distribution occurs. Distribution cooperatives and small municipal utilities have long ridden on the shoulders of these giants, working through contracts that typically stipulate that they must purchase nearly all of their electricity from generation and transmission (G&T) providers. In most contracts, a whopping 5% has been the limit placed on their self-generation, rendering these smaller players [almost] powerless in determining their own energy future. There is some poetic justice in having the small folks granted a spot at the distributed clean energy table. As electric cooperatives and municipal utilities were severely handicapped in their ability to procure their own electricity, they have only dabbled in contracts with independent power producers (IPPs) and other clean energy generators. This came to a head with probably the most unsuspecting sounding cooperative you could think of, the Delta-Montrose Electric Authority (DMEA). As a member-owned, rural electric cooperative based out of southwest Colorado, it is not hard to imagine that the time would come when they would want to be afforded the right to procure their electricity from whoever they please. In an act of magnanimity that perhaps surprised many, the Federal Energy Regulatory Commission (FERC) ruled in favor of DMEA in their case against Tri-State, another cooperative that provides generation and transmission services to 44 distribution co-ops across five states. In short, the ruling lifted the limit on DMEA’s ability to procure electricity from renewable qualified facilities (QFs). The loophole, of sorts, lies in the fact that the Public Utility Regulatory Policies Act of 1978 mandates that utilities must purchase electricity from QF projects. The de facto interpretation of PURPA, for oh the last 38 years, has been that larger-scale utilities and G&T providers would be sole purchaser of electricity from QF projects. DMEA, in a moment of true inspiration, said “to hell with that,” and managed to supersede their contract with Tri-State by asserting that they are themselves a utility, and should be afforded the same rights. This move did not ingratiate DMEA to Tri-State, to say the least, and Tri-State attempted to impose an exit fee on DMEA, which FERC summarily rejected. Message received. Renewables on the grid will no longer be a unilateral decision. Co-ops & Community Solar = Match Made in Heaven It is not hyperbole to claim that this is a game-changer for the nation’s 905 electric co-ops and 835 municipal utilities who woke up following this FERC ruling to a new world of opportunity. How fitting. Co-ops and munis were probably on the leading edge of support for renewables, and now they have license to act on their values, rather than be subjected to energy procurement decisions out of their influence. And that is a very good thing. In fact, it is 987 TWh/yr of a good thing, which if you do the math, implies that the potential market for co-op/muni renewables approaches 400 GW. Many co-ops and other smaller utilities are structured in ways that are much more conducive to serving the public good. Often they are publicly or member-owned, or at the very least not publicly traded, which makes them more intimately connected to their customers and ratepayers than the larger utilities and G&T providers that dominate much of the electric power procurement space. Moreover, they are more likely the engage in novel project types like community solar. There is some cosmic symmetry in enabling co-ops/munis to sponsor community solar projects. It makes so much sense. It seems ludicrous that this was ever challenging to execute at a meaningful scale for many co-ops. According to RMI, the market for community-scale solar projects ranging between 500 kW and 5 MW of capacity each could exceed 10 GW by 2020. Wake-up Call for the Generation and Transmission Providers An ancillary benefit of this new arrangement is that community solar projects may now be easily integrated into the local distribution system, therein avoiding many costly infrastructure upgrades. Translation: electric distribution co-ops/munis may be able to purchase power directly from QF projects at a lower cost than what they are currently charged by their G&T providers. Memo to G&T providers. This also means that they will be reducing their reliance on your services and undercutting your revenues, unless you can evolve together into helping to co-create a clean energy future. Now, there are limits to be sure. Electric distribution co-ops/munis have only been afforded the right to negotiate PPAs (and not just based on avoided costs, as in the past) with QF projects in their territory. Not a bad deal, but it does not make them an autonomous entity. Co-ops/munis still have to balance their energy supply, which can only be done through grid management in the transmission and generation system. So, there may be some building tension in the marriage between electric distribution co-ops and their larger G&T brethren. No one wants to see the G&T providers go extinct. In fact, they are still a critical species in the electric grid ecosystem. But, the challenge will be in better collaborating and coordinating with their member co-op/muni friends. This is not a reach. And there is no better time than now. Look for inspiration? Well, look no further than RMI’s Shine Initiative, an innovative program aimed at helping accelerate solar procurement in the community-scale market. Fragmented Commercial and Industrial Marketplace The recent barrage of articles detailing the bankruptcy of a renewable energy giant (SunEdison) and the pending sale of Elon Musk’s third favorite company (SolarCity) has been nothing short of suffocating. IronOak Insights contributed our own sobering account to the stockpile of SolarCity acquisition articles last week as we didn’t want our readers to think that we were living under a rock. But outside of those two headline grabbing companies lies a diverse ecosystem of large scale developers working to expand the commercial and industrial solar landscape. Per the graphs below, while only 42% of the U.S. residential solar market in 2015 was serviced by regional installers, 70% of the C&I solar market in 2015 was serviced by companies whose names were not SolarCity, SunEdison, Sunpower, or Borrego Solar. Let’s dive into some of the activity within the fragmented C&I solar marketplace. Leading Residential Solar Installers in the U.S. in 2015 (market share by MW installed) 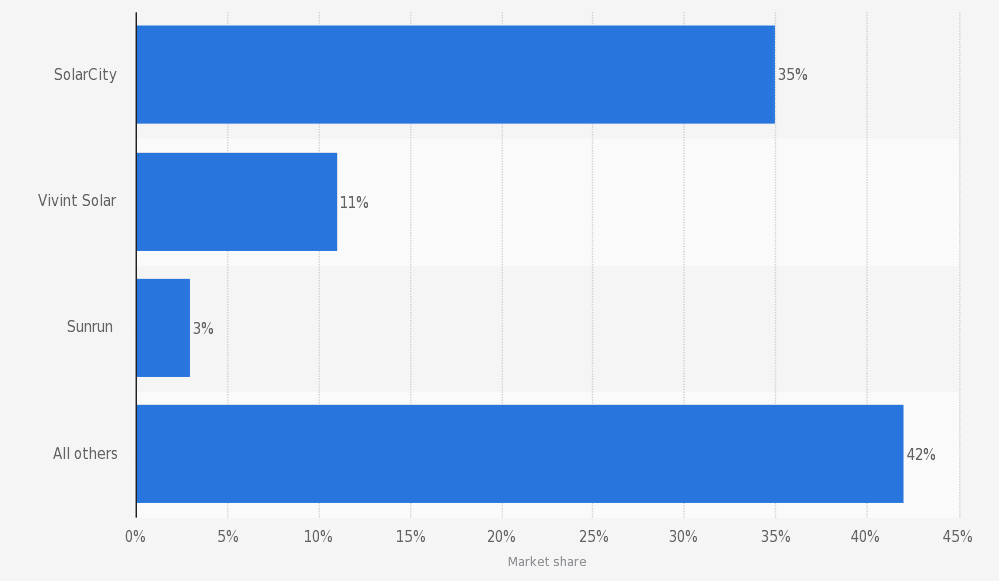 (Source: Statista) Leading Non-Residential Solar Installers in the U.S. in 2015 (market share by MW installed) 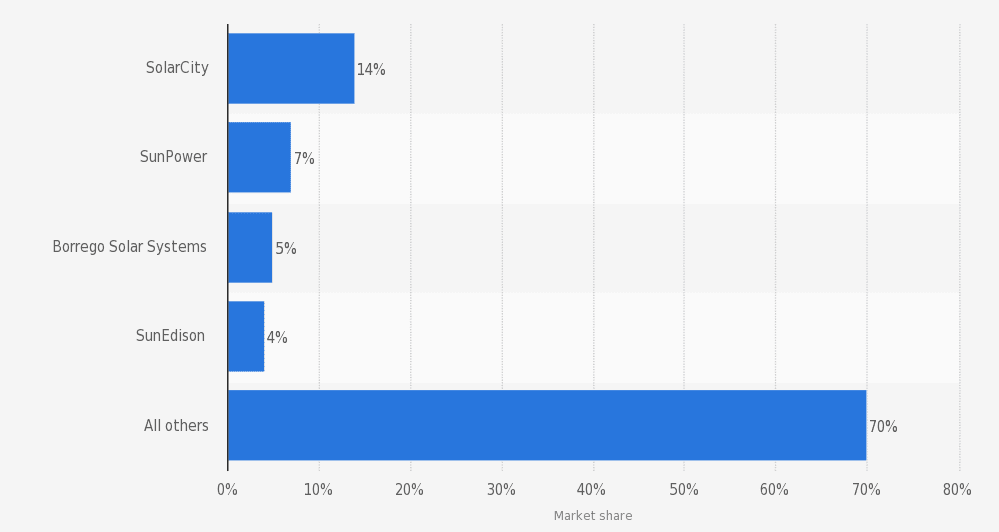 California’s Cash Crop
As the perpetual leader in the U.S. solar race, California dominates every other state with its relentless pipeline of large-scale solar PV projects. The state’s consistent appeal exists because above-average electricity rates are coupled with some of the best insolation in country, along with a small state program called the California Solar Initiative. In addition to solar electricity generation, all of that sunshine has long supported California’s agriculture industry, and now California-based solar developers, like CalCom Solar, are targeting Ag companies as perfect companions for mid-scale PV facilities. CalCom recently completed a 2.2 MW solar farm for a fruits and vegetable grower, and the single-axis tracker installation now stands as the largest customer-owned, net metered system in Monterey County. CalCom is one of many developers across the country that are leveraging USDA REAP (Rural Energy for America Program) grants along with the federal ITC to provide attractive PPA rates for applicable off-takers. PFMG Solar (Partners For Many Generations), a top 15 U.S. solar developer, also takes a targeted approach in California by focusing on mid-scale solar solutions for suitable school districts. PFMG recently completed a 1.5 MW installation for a California school district and they’re a likely candidate to pick up some of SunEdison’s solar assets related to education centric off-takers. Full Steam Ahead in Colorado and North Carolina Just this week, Xcel Energy received the Colorado Utility Commission’s approval to move forward with the utility’s plan to develop 29.5 MW of PV from community solar projects. This is welcomed news for Denver-based community solar developer SunShare who commissioned a1.5 MW community solar garden in Arvada, CO on June 21st. SunShare joins Community Energy and Clean Energy Collective as the three juggernauts supercharging the community solar space in Colorado. Community Energy made headlines recently when they offloaded six North Carolina-based projects to Duke Energy with a total capacity of 30 MW. North Carolina’s solar market has remained strong despite the repeal of the state’s lucrative 35% solar tax credit. San Francisco-based Ecoplexus also recently completed six projects in NC, totaling 54 MW and requiring $79M in total investment. Ecoplexus has 36 MW under construction and claims more than 1 GW in their development pipeline that spans across 12 US states and dispersed international development. The West Texas Solar Patch Have you ever imagined an oil field man camp with LED lighting, tankless hot water heaters, and bike racks? Me neither, but maybe that concept becomes a selling point for solar field workers relocating to West Texas for the impending solar boom. ERCOT, the grid operator that services 90% of the Texas electric grid, is anticipating more than 560 MW of PV to be installed in Texas during 2016. That’s more than double the 212 MW installed during the previous year. Texas already ranks 9th in the U.S. in terms of installed solar capacity, and many analysts are expecting that ranking to climb up in the coming years. Texas, specifically West Texas, has some of the highest insolation in the U.S., large tracts of suitable land, low regulatory costs, and above average electricity rates. Although solar produced electricity will only account for 3% of the state’s generation capacity in 2017, ERCOT is projecting solar to supply more than 17% of the state’s electricity by 2030. While a large percentage of the anticipated development will come from utility-scale developers including First Solar and Recurrent Energy, regional developers will still have the opportunity to fill a void in the marketplace. I recently spoke with a developer that was already complaining of long interconnection study delays, so make sure to get your paperwork started sooner rather than later. 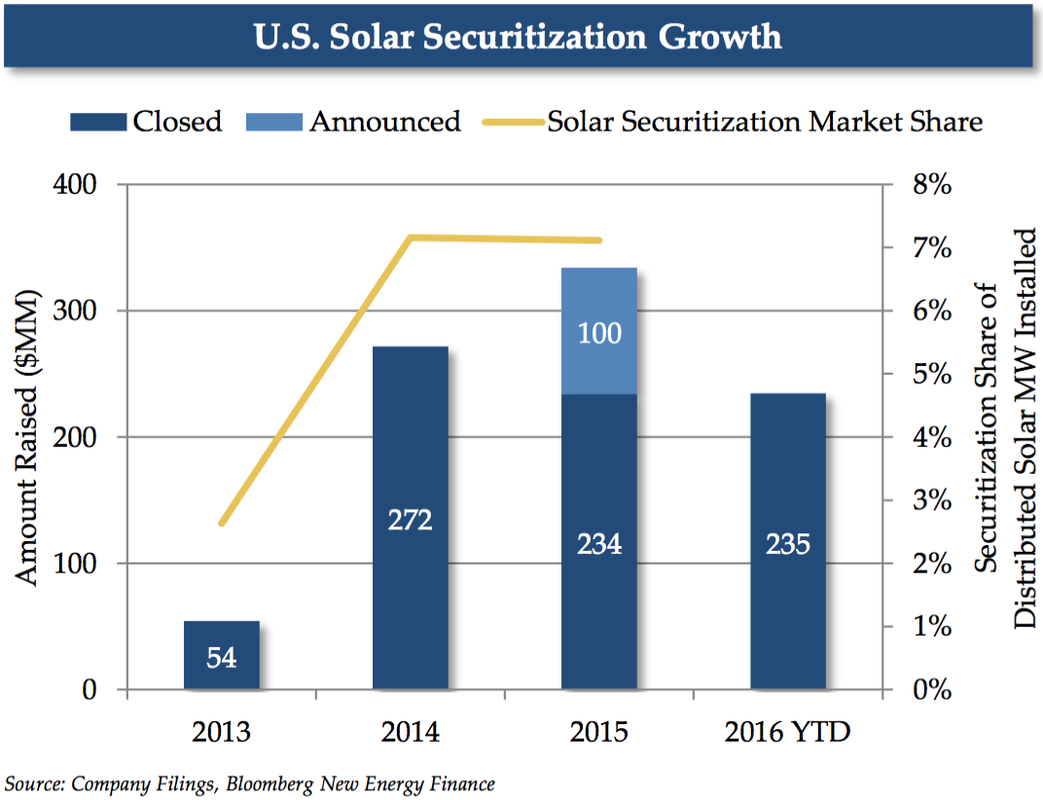 Solar securitization has been a popular theme at IronOak Energy, and for good reason. Access to gobs of low cost capital is every solar developer’s dream, along with, of course, limitless net metering (but what about Value of Solar?), a permanent ITC (debatable), and friendly utilities (now you know I am reaching - just kidding...kind of). As opposed to the other items on the solar developer wishlist, solar securitization is actually happening in real time. Pioneering companies like SolarCity and SunRun are paving the way with new securities offerings as we speak. The market is not huge, but has crested the $300M mark in 2015. This past January, SolarCity completed its first securitization of distributed solar loans, and achieved the industry’s first investment credit rating. Others will undoubtedly follow, if the way is clear. Back in June of 2015, we wrote about the idea of solar securitization finding more traction in the market. But, be careful what you wish for. While securitization may be the shiny new-ish finance toy for the solar industry, it is not a one-size-fits-all solution to finance (or refinance) projects. But be wary of the double-edged sword of solar securitization The solar industry rides on the shoulders of tax equity investors, at least until the ITC is phased out. As such, one must consider — how would securitization change the project finance equation? For one, securitization would expose tax equity investors to potential recapture of any unvested credits. Translation - backing a security with projects that do not utilize any tax equity will make the deal much simpler and more palatable. But who wants to leave money on the table? Luckily, the inverted lease was designed to tackle sticky tax equity issues like this and can be used to mitigate this recapture risk. As of 2014, SolarCity and SunRun started to create solar securities primarily of inverted lease arrangements. Problem solved. But that is not really the only issue that should concern project developers. The dark cloud hanging over solar securitization is that developers or third-party asset owners would have some of their upside undercut due to the fact that their equity in the underlying assets relies on retained value. Equity holders are always at the end of the cashflow line, but adding security holders to the mix places yet another claim on the project cashflows before equity holders get a piece of the pie. And that pie needs to be comprised of sweet, high-grade offtakers. As we all witnessed in the mortgage-backed security debacle, bundling lots of disparate (even toxic!) assets into a nicely packaged security may doop the market for a while, but it will come back to bite you. The same holds for solar-backed securities. Which means that not every residential or C+I solar project is going to pass muster as a security-grade product. This is one of the reasons that the initial transaction costs for creating a security are substantially higher than essentially any other project finance mechanism. High transaction costs along with the additional cost burden of compliance reporting can start to eat into that delectable low cost of capital, unless you have your ducks in the row. Some seriously good reasons to dip your toes into the securitization pool The first thing that you probably said when trying to sound smart about investing was “diversification.” I’ll wager the second thing you said (and you really had no idea what this meant) was “liquidity.” Diversification and liquidity are two of the primary ingredients in the low cost of capital cake mix. Diversification because high concentrations in terms of geography, offtakers, operations, and policy attract those pesky risk premiums that increase the cost of capital. Liquidity because it is the lubricant that allows markets to function and buyers and sellers to repeatedly engage in transactions. Add in a little sponsor bankruptcy risk mitigation and some public credit ratings to the mix and you have the makings of a very enticing offering to gargantuan fixed income institutional investor class. And what do institutional investors like more than anything? You guessed, boring standardization. All those legal and accounting fees that allow you to create boring, standardized securities also unlocks a velocity and scale of financing that could leave traditional project financing in the dust. Institutional investors have been invited to table, but will they dine? As we know, institutional investors have a big appetite, which, in the case of solar, has meant that they can only find the requisite scale in bigger utility-scale deals. Securitization could hold the key to allowing smaller residential and C+I projects to access lower cost capital from institutional investors. This issue of scale is a big one though. Securities of the size that would attract institutional investors have been few and far between. The question of the day is who can follow SolarCity and SunRun’s lead to bring the solar securitization market out of the hundreds of millions and into the billions. Related data points:
Further reading:
Feed In Tariff (FIT) programs have been the lynchpin of solar growth, but is it time to move on? 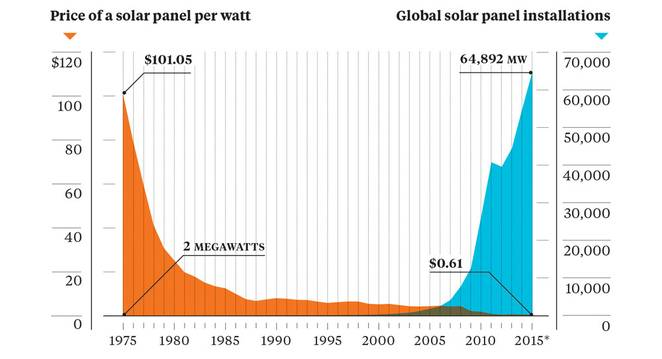 Source: Earth Policy Institute/Bloomberg Feed-in tariff (FIT) programs were designed to entice new entrants into the solar market during a time of learning and experimentation. Initially, they were designed as value-based instruments in which compensation was tied to various external benefits, such as avoided externalities (fancy term for coal plant pollution). But this model was a bit pie-in-the-sky, and left a lot of uncertainty and unpredictability on the table for investors and developers to navigate. The resulting high project financing costs ended up being a major deterrent to the type of catalytic growth that was hoped for. The real magic of the feed-in-tariff was unlocked when there was a shift to cost-based instruments, wherein a solar developer would get compensated for the costs of development plus some reasonable rate of return. The fixed-rate, long-term guarantee of cash flows was music to investors’ ears, and the solar market was off to the races all across the EU, China, India, and South Africa. Interestingly, no North American country has instituted a FIT program to date, and rather have opted for more circuitous policies such as Renewable Portfolio Standards. We now have a solid track record by which to evaluate the successes (and failures) of FIT programs around the world. On the surface, much of the success of solar markets worldwide is attributed to FIT programs. But there is a creeping concern that this success will not last much longer. FIT programs solved one problem by creating stable, long-term cash flows for solar projects, which could be underwritten and financed by savvy investors. This accelerated adoption and experimentation with different technologies and business models, but more importantly it sped up learning (decreases in costs due to experience or scale). In solving this market catalyst problem in the short term, governments left the door open in the long-term for gaming the system if and when solar prices (really LCOE) started to dip well under the FIT rates. And that is precisely what has started to happen. The bull rush to obtain legacy FIT program rates once technology costs plummeted has fueled a massive boom in solar. On the the surface, this seems like a great problem to have. More solar! But, this is a case of too much too soon, and governments are responding by pulling back on their FIT programs and leaving a wake of solar developers scrambling to make their projects pencil. 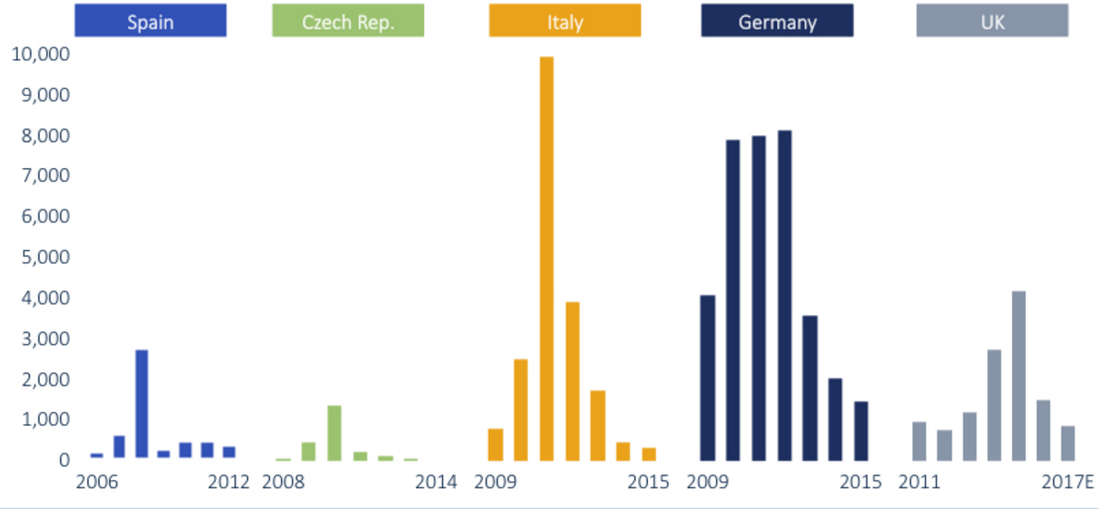 Source: GTM Research The European renewable miracle has been taking some nasty hits lately. Even the energy transition darling, Germany, has not been immune to the pervasive bust cycle that is spreading across the continent. What changed so quickly, you may ask? Well, it is the classic story of a good thing gone bad. The FIT programs that accelerated solar adoption so quickly in years past are now becoming the victim of their own success. Where they erred was in making the terms so enticing for so long that they ended up overheating the solar market. There is a delicate balance between creating an incentive to attract risk-taking early adopters and reducing or retracting the incentive once the economics of the market support broad participation. Or, in other words, they just let too many players at the table, and this time, the cards were stacked against the house. Governments underestimated the speed at which solar prices would fall, which left them in the undesirable position of having already committed to paying well above market prices. It was boom times for the solar industry, but it could not last. The graphs above look like tulip mania (if this reference eludes you, please read for some amazing dinner table chatter) for crying out loud. Germany had three years of putting over 8 GW online. Italy spiked in 2011 with nearly 10 GW of solar, only to plummet to under half of that in the following year. The UK has witnessed a remarkable growth in solar, only to cut the FIT program by 65% in one fell swoop. Similar patterns were seen in many other EU countries. And let’s not forget Japan, whose boom-bust cycle dwarfs those of all of the ill-fated EU countries already mentioned. Japan is still in the top 3 globally in terms of annual solar capacity installed, but is headed for a protracted decline in solar over the years to come, again due to an over-aggressive FIT program. But FIT programs are so simple and elegant. What alternatives exist, you may ask? 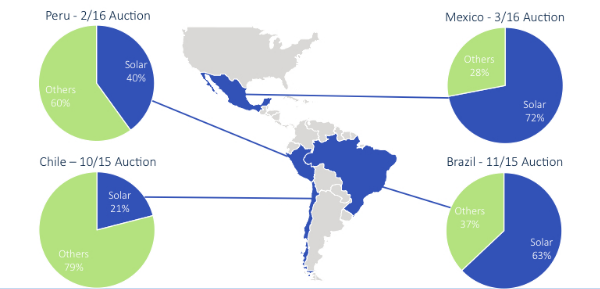 Source: GTM Research Letting go of a good thing is hard, especially for an industry like solar that may suffer from a tinge of PTSD from the head-spinning boom-bust cycles of the past decades.
After all, with the FIT structure solar did not necessarily have to directly compete with other generation technologies. A decade ago, that was just fine because solar would not have been competitive. Solar needed an incubation period to slide down the learning curve to lower, more competitive prices and meaningful deployment scale. Now that solar can tout itself as being one of the most cost effective electric generation technologies out there, there needs to be an increasing willingness to actually compete in markets with other generation technologies. Latin America has started to buck the FIT model in favor of an auction process in which solar competes with other generation technologies, both from independent power producers and incumbent utilities. This has helped feed a boom in Latin American solar, as it turns out that solar can beat out nearly all other generation technologies on a pure LCOE basis. Nearly three quarters of new capacity additions in Mexico will come from solar, easily more than 1 GW. Brazil is in the same league. And various EU countries and India are also doubling down on auctions. But, auctions are not a panacea. We have all seen auctions in the movies, and the meme of the irrationally exuberant bidder going well beyond their true willingness (or ability) to pay in order to secure the prize. While we all hope that power producers are somewhat more measured and rational in their approach to bidding in these markets, there remains the possibility that competing in auctions may drive prices down quickly to unsustainable (even unprofitable) levels. In fact, some early evidence in the auction tea leaves is that even these markets can overheat as bidders aggressively pursue market share. On the one hand, it may be good for business in the short-run, and auctions may effectively accelerate learning and cost reductions. But, on the other hand, auctions run wild may undermine the long-term viability of the ecosystem of power producers feverishly competing to keep up with the Joneses to survive. Exuberant bidding to support short-term growth is not a phenomenon that should feel altogether unfamiliar, as it is precisely what drove SunEdison to bankruptcy. Further reading: As Feed-In Tariffs Wane, Auctions Are Enabling the Next Wave of Solar Cost ImprovementsFeed-in Tariff: A policy tool for encouraging the deployment of renewable energy technologiesInnovative Feed-in Tariff Policy Designs that Limit Policy Costs A Policymaker’s Guide to Feed-in Tariff Policy DesignFeed-in Tariff Policy: Design, Implementation, and RPS Policy Interactions SolarCity Residual Cash Flows 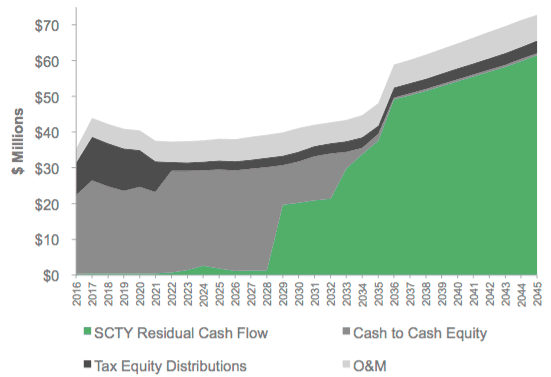 (Source: SolarCity) SolarCity is still the prettiest girl at the dance SolarCity is without a doubt the most trend-setting solar finance company on the planet. They are a vertically-integrated, distributed solar superpower that seems to grab newsworthy headlines on a weekly, sometimes even daily basis. On April 6th, SolarCity announced a $150 million non-recourse financing facility with Credit Suisse to support the deployment of new commercial PV and energy storage assets. The very next day, the company announced a tax equity closing of $188 million from Bank of America Merrill Lynch for residential solar deployment. At first glance, that amount of activity could worry investors that SolarCity is pursuing too many verticals in parallel without focusing efforts on the most profitable segments. This type of investor sentiment is currently relevant considering that the mainstream explanation for SunEdison’s bankruptcy is simply that the company took on too much debt while drinking water from several different fire hoses. I would argue that SolarCity is similarly extended in terms of asset classes, but they have been consistently more savvy than SunEdison in regards to monetization. Unlike SunEdison, SolarCity has maintained a focus on creative financial engineering that produces near-term cash flows to sustain the upfront capital outlays required by today’s solar finance institutions. John Hancock to the rescue? On May 4th, SolarCity completed a $227 million “cash equity” financing with John Hancock Financial for approximately 200 MW of operating solar projects. This transaction serves as the most recent example of SolarCity monetizing the underlying cash flows associated with the company’s long-term power purchase agreements with individual off-takers. Unlike the two transactions in April, John Hancock’s injection is not a critical component of the capital stack to initially finance the development and construction of solar projects. This cash equity transaction is regarding solar assets already in operation, across three segments (residential, commercial, industrial), and spread between 18 U.S. states. Within this portfolio, the average FICO score for residential customers is 744, and most of the commercial off-takers are national retailers. News flash: large institutional investor is attracted to diversified portfolio with virtually no risks. Which begs the question, why did SolarCity take a discount on future cash flows and sell now? Just like every other solar company in the 3rd party ownership space, SolarCity is bleeding cash due to the high customer acquisition costs and needs to display short-term revenue to keep shareholders confident in the company’s long-term value proposition as a distributed power provider. See here for a current perspective of the 3rd party ownership climate in the U.S. Despite the success of matching low-risk solar PPA payments with an institution that is all too familiar with generic annuities, SolarCity now has some longer term expense considerations to overcome. They are still responsible for the O&M expenses related to servicing the 200 MW of assets, and they’re responsible for expenses related to decommissioning the PV systems if the PPA term is not extended. As part of the cash equity transaction, SolarCity retains the rights to 99% of the post-PPA cash flows, but it's anyone’s guess how likely it is that post-PPA revenue streams will be realized. Although this transaction structure is new and newsworthy, it’s just another tool in the solar finance industry’s toolbox to monetize future cash flows. SolarCity Cash Flows 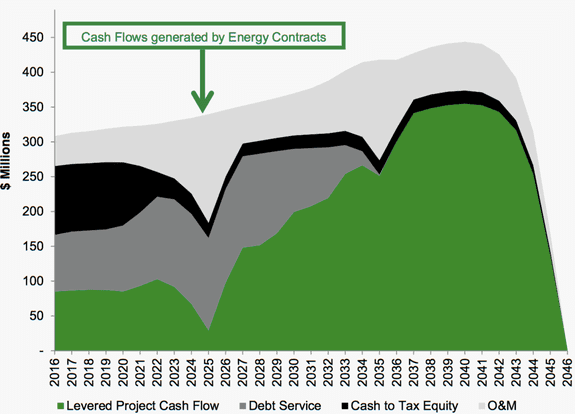 (Source: SolarCity)
The jury is still out on whether solar and securitization are a match made in heaven Asset-backed securities have a negative connotation to the layperson, to say the least. But there’s no denying that securitization can play an important role in increasing investor access to specific asset classes, as well as raising affordable sources of financing in capital intensive industries, like solar energy. The key word here is affordable. SolarCity has now sold six tranches of solar-backed securities over the last 30 months, including $49 million on March 1st when the weighted interest rate was almost two percentage points higher than a sale just 12 months earlier. The rise in SolarCity’s cost of capital is troublesome and may cause the company to abandon the new strategy and seek out alternative forms of financing. It’s clear that the 'SunEdison effect’ is having a real impact on investor comfort with the reliability of long-term solar contracts, despite the incredibly low default rates experienced by SolarCity (and others) to date. As long as default rates remain very low and companies continue to drive down the cost of customer acquisition, the opportunity to sell the underlying cash flows of solar projects will remain for both public and private developers.  (Source: GreenTech Media)
Everyone likes lists. Lists are candy for our mind. Give me a Top 10…, and my mind naturally embraces the elegant hierarchy, 1 better than 2, and way better than 10. A simple rubric for a messy world. So, it was with some curiosity that I digested Ernst & Young’s Renewable Energy Country Attractiveness Index. See renewable energy is complex, and lists are simple, so this makes a good pairing. Like red wine (complex, hence - see, swirl, smell, sip, savor) and chocolate (simply delicious). What do we find? Clearly, United States #1! As if… The BICS - Brazil, India, China, South Africa (sorry Russia) - are all in the Top 11 and are the big upward movers. Just fascinating considering the sheer scale and dynamism of those economies. Latin America is on the rise with Chile, Argentina, and Mexico all in the Top 20 (and Summer Olympics in Rio!). And Europe is increasingly looking like a basket case. Germany, France, United Kingdom, Netherlands, and Belgium all dropped spots. Regrettably, some petulant factions within the EU are backpedaling on much of the industry-paving progress of the previous decades. What a mess. Sophisticated European investors will likely migrate into international renewable markets. After all, a 4% unlevered IRR is not going to winning any beauty contests. The ascendant BICS and Latin American countries are the investor darlings of the moment. But the renewables investment landscape is not as simple as that. For this, we another list! The Venture Capital & Private Equity Country Attractiveness Indexmeasures the...well, it basically says it in the title. Rest assured, United States #1! As if… But some mind-tickling asymmetries arise between these two lists. Ahhh -- when lists tell contradictory stories, it makes us to have think! Some countries have an attractive investment environment for renewable energy but an overall weak (or altogether suspect) environment for VC/PE investors. Take, for instance, Argentina. 18th for renewable energy investing, but a lowly 64th for VC/PE investing. Lest we forget - the economic scene in Argentina can get a little wobbly at times. A similar pattern holds for South Africa, Brazil, Morocco, Egypt, and others. All great places for renewables, but a little shaky for investment in general. So, I leave you with the holy grail concept of risk-adjusted returns. How might you adjust returns to account for risk? Well, that is more of an art than a science. No simple list can tell that story. 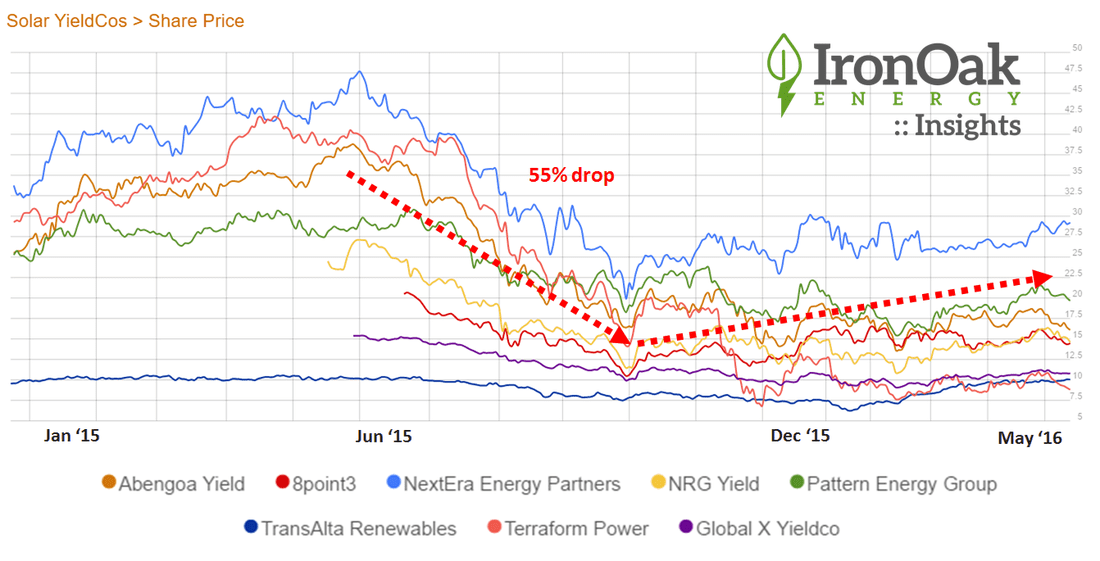 Last year, IronOak Energy’s investment advisory practice had some challenges competing against yieldcos on behalf of our solar investor partners.
We kept abreast of the yieldco’s up/down trends at IronOak’s stock chart. They were offering what some called “a stupid low” cost of capital. That was sometimes said as a judgment on the the yieldco business model. Other times it was a said with a slight jealousy: “I wish our yields were still attractive at those levels so we could win more deals with predictable long-term cash flows.” Developers licked their lips. Those low-yield requirements made their discounted cash flow models really sing. As we all know, in late summer last year, both developers and yieldcos bought their share of Kleenex boxes. But this was great news for private equity and helped improve their returns. Many claimed the model was broken. We thought that was shortsighted. Sometimes innovators hit a speedbump, but then they hit the accelerator again. Now several yieldcos are getting ready to go to public markets. It’s not time for them to be big-time project buyers at attractive costs, but that time will come. For now, private equity still rules. Everybody loves solar. Well, except for those who think solar panels cause cancer and prevent plant photosynthesis. (Seriously. Summary here.) But we digress… Solar projects makes for great headlines, company brochures, and dinner party conversation. But are these good infrastructure investments? (Let’s keep investments in companies separate for now. Venture capital and public equities are very, very different beasts.) If you ask Warren Buffett, he has already answered, with more than $15B invested in solar (and wind) projects. I hear that he’s a pretty good investor, so that says something. And if you look at the two graphs below, then you should agree that the market is trending up. 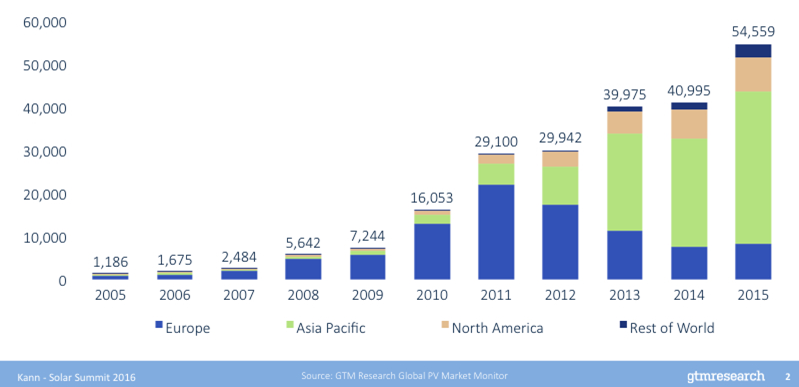 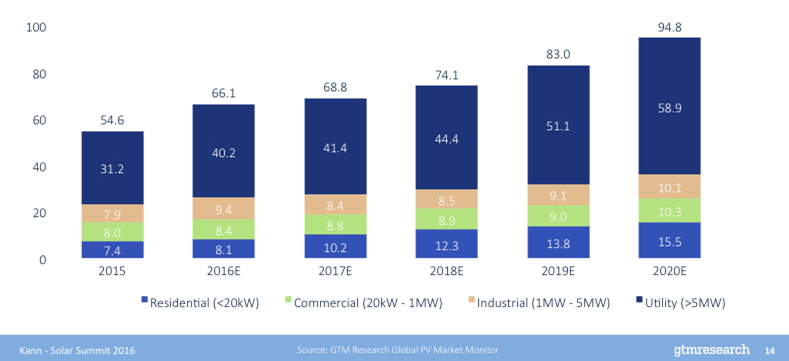 Predictable markets, especially at the utility scale, with 5-year projected growth of 1.9x versus 2015. Residential solar also looks strong at 2.1x growth over the same period. However, commercial and industrial markets may only increase about 1.3x, with one-off credit risks that challenge scaling. So, go long on U.S. solar, right? Broadly, yes, but the devil is in the details. Picking the right market, site, developer, offtaker, and finance model will, of course, make or break the deal. And these are just U.S.-specific projections. The world is a big place. Now let’s look at other countries’ experience. Summary: It’s not predictable year-over-year growth for many years. The graph below tells a different story: Solar project investments are better defined as taking a ride screaming with joy and pain on the “solar coaster.” 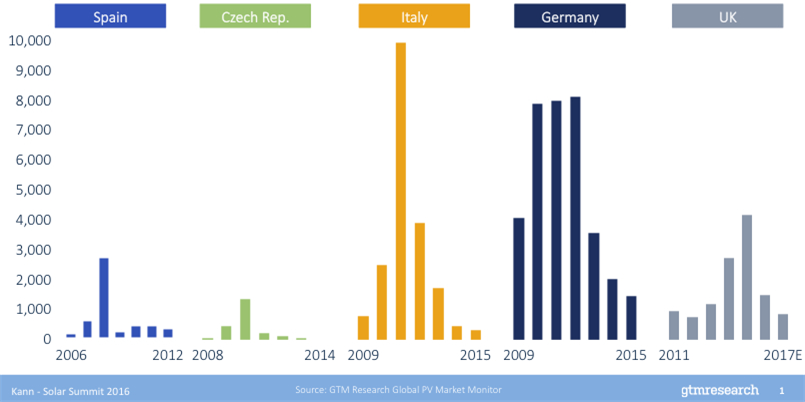 So, short solar markets in certain countries? Well, maybe, though not technically easy to do since this is mostly private, not public, equity. In summary, should you go long or short on solar infrastructure? Um...yes, let’s grab a beer and talk in more detail. States Authorizing 3rd Party Power Purchase Agreements 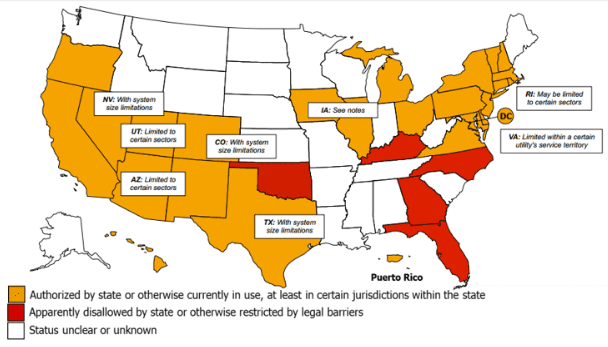 (Source: DSIRE) First, the bad news: policy battles over 3rd party ownership of solar muddy the waters Just pile it on top of the other cadre of unenlightened policies that North Carolina is behind these days. Yes, North Carolina, my home state, is making headlines for another boneheaded public policy move, this time regarding the highly controversial topic of… solar! The NC Utility Commission (NCUC) recently upheld a law that prevents 3rd party ownership of solar projects. The case that brought the issue into the public limelight concerned a whopping 5.25 kW installation that the environmental advocacy group NC WARN had built to provide electricity to a local church. The two parties signed a 3-year PPA at a discounted rate, which, doing some quick math, might have provided around 23,000 kWh per year valued at around $4,000 or so for the life of the PPA based on prevailing rates. Well, Duke Energy was not having it! The biggest utility in the nation, valued at over $55 billion, opposed NCUC and beat down this encroachment on their business. And just to make an example out of NC WARN, they were slapped a $60,000 fine, which is around 15x more than the electricity that would have been sold in the PPA arrangement. Duke Energy is not entirely foolish to help combat the proliferation of 3rd party ownership, but their choice to do so goes against the countervailing inertia moving us into a more distributed energy future. Duke Energy will surely be fighting an uphill battle on this issues for years to come. North Carolina is not alone in this business of prohibiting 3rd party ownership of solar projects. The state stands in solidarity with Florida, Kentucky, and Oklahoma, which sounds like a NCAA Final Four (pause for sad memories of UNC’s recent loss). Unfortunately, that is where the commonalities stop, because, in the case of solar, competition (in this case with incumbent utilities) is prohibited. The game is rigged in favor of utilities with virtual, if not actual, monopoly power, something that supposedly goes against federal trust law. As a North Carolinian, it is with deep regret that I admit that South Carolina (!) recently passed legislation to allow for 3rd party ownership of solar projects. Georgia has done the same (although not accounted for in the map above). So, take heed, NCUC, your neighbors to the south are upstaging you on the transition to clean energy. Well done. Just add it to the list... On a positive note, 3rd party ownership trends are helping to unlock potential in the behind-the-meter corporate solar market Commercial PV Installations by Ownership Structure 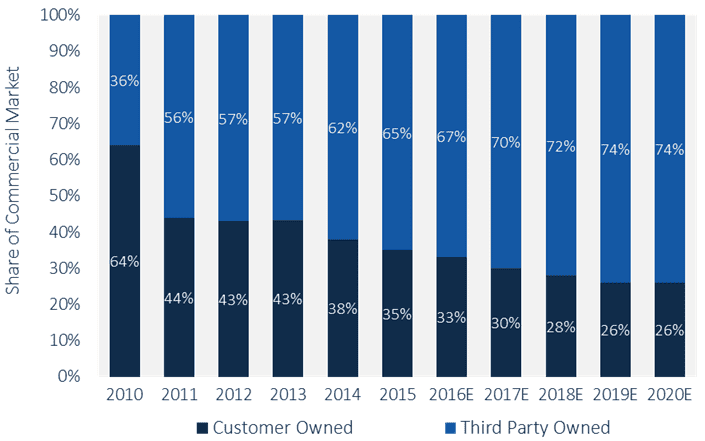 (Source: GreenTech Media)
With all of the pushback on 3rd party ownership of solar in certain states, one has to consider what might happen if this was allowed. Well, one thing is for certain - corporations would be buying into solar, and likely in a big way. This is, after all, the situation that we see in states that allow 3rd parties to sell electricity from solar projects to corporations. As solar has become more competitive with prevailing retail electricity rates, corporations have started to see locking in stable electricity prices from solar as a complete OpEx no-brainer. Though a handful of corporations opt for the direct ownership and financing approach, the vast majority are seeking 3rd party owners to provide them with solar solutions. And those trends are expected to continue, as shown in the projections above. I go into further detail on this topic in a previous blog. So, what is to like and dislike about this arrangement? One the one hand, 3rd party ownership does fundamentally decentralize the electricity provision business, especially as behind-the-meter applications become more reliable and cost-effective. That is seen as a threat to incumbent utilities who have historically been the end-all-be-all of power provision. Setting aside utility concerns for revenue loss, the real question is whether utilities can meet the needs of large offtakers looking for distributed power solutions. The answer is yes and no, depending on the utility. It seems like 3rd party solar ownership is here to stay, so what’s the catch? This gap in the market opened the door for an explosion of independent power producers, offering a staggering array of behind-the-meter solutions to customers. Some of these we have come to know well - SolarCity, SunRun, Vivint, etc. But there are many others vying for a place near the top of the pecking order. So, what of the risk of working with these solar companies? It really boils down to counterparty risk. Two parties really have to believe that each other will continue to exist as solvent enterprises for decades to come. Not a trivial proposition from the standpoint of a corporation analyzing the evolution of the solar industry, perhaps for the first time. Clearly, the ongoing tumult of the growing solar industry (aaahh SunEdison chuuu) brings to light the sometimes ugly process of picking winners and losers. It would not be unreasonable to assume that the landscape of solar companies out there will continue to change for some years to come. So, why should you sign a decades-long PPA with a company that may not continue to exist for the next five years? That is the question of the moment. But if the data are any indication, corporations are becoming increasingly comfortable with signing long-term PPAs with 3rd party solar power producers, not to mention homeowners. So, back to the original story, what are the NCUC and Duke Energy, in a classic “tail wagging the dog” relationship, so worried about? It might be the “adapt or die” mantra that has been reverberating around the industry since the collapse of several European utility titans. But rather than adapting, they are digging in their heels on an issue that 46 other states in the U.S. have already come to an agreement on. If there is anything that we can agree about the future, it is that change will be ever present. 4/30/2016 It’s the offtaker, stupid! What we should have known from the start about community solarRead Now What’s new? As many have predicted, community solar continues its nationwide growth. We previously discussed the fourteen states that have adopted specific enabling legislation for community solar. With the growth in business potential, more and more states are working to adopt or revise policies to accommodate this new model for distributed energy generation. According to the NC Clean Technology Center, in Q1 2016, seven states have considered, amended or clarified rules governing community solar programs; and in states that are slow to respond, utilities are taking the lead, submitting proposals for community solar programs without a specific enabling legislative framework in place. According to SEPA’s recently released report, “Community Solar: Program Design Models,” there were 68 active programs in 23 states in the summer of 2015, with many more programs being planned. Geographic Distribution of Community Solar Projects  (Source: SEPA) In New York, EnterSolar started construction of the first community solar project in the state. Relatively small in terms of capacity (less than 1 MW), the project is developed under New York’s first phase for community solar development that limits development to areas with the highest grid locational benefits and to low-income communities. This month New York enters the second phase of the program that allows for full implementation of net metered community solar projects across the state. Many developers are already working hard to secure development contracts, and even the city of New York has introduced a municipal plan to promote community solar developments within city neighborhoods. What’s wrong? Nothing is wrong with community solar. On the contrary, we think that community solar is awesome. However, despite its great potential to unlock solar energy to more than half of electric consumers in the U.S., and although it is gaining traction nationwide, development rates for community solar are nevertheless 20% lower than expected. Even in states that have addressed management structure and regulatory uncertainty concerns projects are still not springing up as one would have expected. So what is it? Why aren’t we seeing more community solar projects? It’s the offtaker, stupid! The reality on the ground is that developers and utilities are still struggling with selling community solar to customers. Relatively complex in structure and less known than other models of distributed solar generation, community solar is a hard sale. Customers are wary of entering into unfamiliar financial adventures involving multiple parties, especially when the transaction involves an upfront investment as is the case with most community solar schemes. Part of the challenge lies with the fact that customer attitudes to community solar vary. While some programs are fully subscribed and thriving, others are underachieving. Many have tried to identify the winning set of program features that makes a community solar project appealing, but because regulatory frameworks, transaction structure, and management schemes vary greatly from one project to another, identifying best practices from existing projects has proved to be an elusive task. However, a recent study conducted by Pacific Consulting Group, might have finally revealed the answer to the question of what makes a community solar project successful. Taking a creative approach to solving a persistent problem, PCG focused on customers instead of projects. PCG conducted a market survey among potential offtakers in eight community solar states, asking respondents questions aimed at identifying how market acceptance of community solar changes with project features. Unsurprisingly, the number one factor in customer acceptance is initial investment; projects that do not include an initial investment or require only a small upfront investment are highly valued. The second is percentage of electricity bill to be covered by the investment; the lower the percentage of the bill covered, the less attractive is the project. Together, the two attributes account for 20% of total importance. Other interesting findings are that customers value savings five years out as more important than immediate savings (suggesting that customers are not intimidated by the long-term commitment associated with community solar), customers are largely indifferent to what they lease or own, and are not persuaded by incentives other than the potential payback (e.g., late fee forgiveness). Relative Importance of Seven Program Attribute on the Decision to Adopt Community Solar  (Sources: PCG; SEPA)
The study also measured customer responsiveness to marketing approaches and revealed interesting trends among communities. The most important findings are that messages emphasizing customer ownership and individual economic gains resonate better than messages emphasizing conservation or “green” considerations. Utilities, nonprofits, and solar organizations enjoy better credibility and therefore have better prospects in influencing potential customers than other entities or individuals (indicating the value of business partnerships). Also, personal messages targeting individual customers are more effective than mass media (with a message on the utility bill being the most effective form of customer engagement). All I want is peace of mind Understanding how to approach customers and how to tailor transactions in a manner that is appealing to potential offtakers is very important for the continued growth of community solar, but it is not enough. Even after we have addressed project features, payout structure, and marketing strategies, we still need to find an entity that will manage the project once it is operational, and long-term management of multi-party endeavors is costly. Some states have tried to address this concern by introducing an intermediary special purpose entity responsible for aggregating membership interests and managing the relationship with the local utility. But the question of cost and management remained largely unanswered, at least until now. Responding to market needs, community solar management firms are emerging. Firms like Clean Energy Collective offer management platforms that ease operations, reduce costs, and give offtakers, investors, and utilities exactly what they need - peace of mind. Institutional investors have been reluctant to invest in solar, until now Perceived risks have long dissuaded institutional investors from venturing too deep into solar investments. Fortunately, perceptions can change. Whereas once the solar industry was hampered by the perception that technology was risky, markets were untested, and policy uncertain, now the solar industry is increasingly seen as a low-risk infrastructure investment that is increasingly enticing for the less risk tolerant institutional investors out there. Asset Financing for New-Build Renewable Energy Assets ($B) 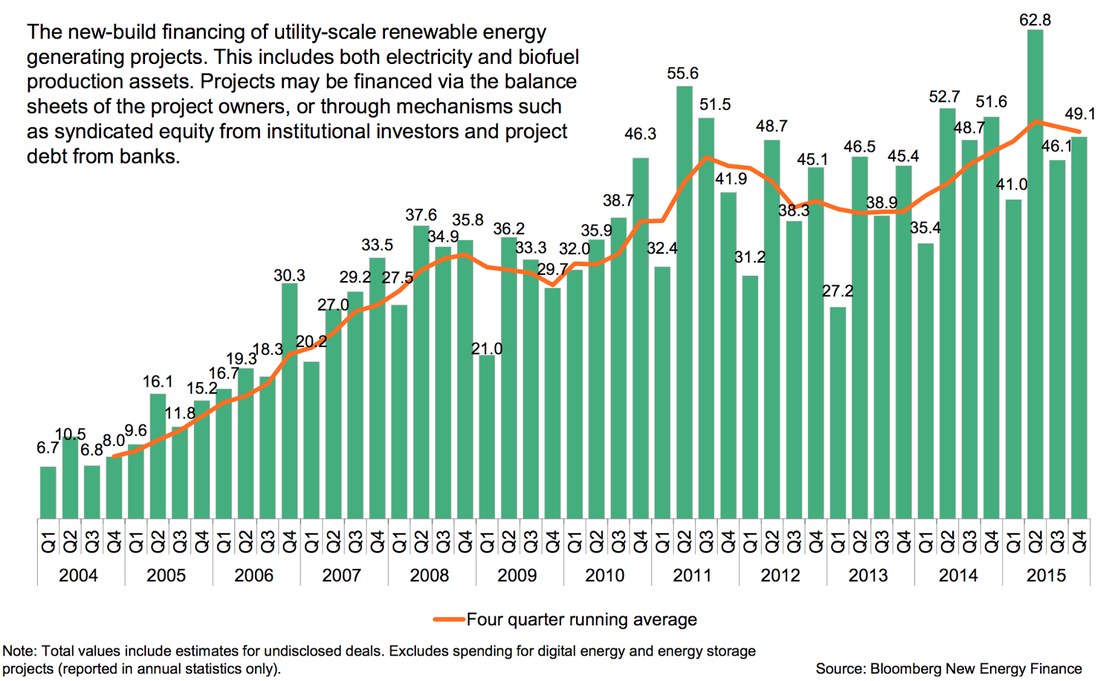 To be sure, the solar investment space is pulling in interest from institutional investors, but it is also being pushed out of many fixed income and treasury investments due to the extended period of low interest rates.
Now that those “risk-free” assets are now also return-free, investors are anxious to explore investments with stable and predictable yields, ideally that generate free cash flows. As solar performs more like an infrastructure investment, with contracted cash flows, predictable technology, and a very long runway of future demand, interest from institutional investors is piquing. The question is - can solar meet the scale and risk-return profiles that institutional investors require? Can clean energy projects match the capital and risk profiles to entice investment? There are many ways that institutional investors may want to increase their allocation in clean energy - green bonds, low-carbon investment funds, etc. — but here I am going to focus on direct investments in projects. Over the last decade, the solar industry has expanded into a highly diffused ecosystem comprised of a large range of developers, EPCs, OEMs (though many fewer of these), and financiers. On the financing side, the availability of debt and tax equity has been a key driver of where and what type of projects could be built, and sponsor equity providers have come in as the final layer of the capital stack. Many solar projects with stable cash flows for 15-20 years and limited construction risk can yield returns of 10% or more, which easily beats the returns that can be achieved in the bond market. To really catch the eye of an institutional investor, portfolio sizes need to be in the $100s of millions, ideally yielding unlevered returns of 8% or more. Though large scale projects and bigger portfolios of projects have started to come through the pipeline, it is still difficult for a single developer to create an investment opportunity of the scale and risk profile that serves the needs of institutional investors. Even when these investment opportunities exist, institutional investors are wary of direct investments that expose them to illiquidity or diversification risk. Because of this, much of institutional investment to date has been in providing debt restructuring or acquiring an equity stake in operating assets, as most investors do not want to take on development risk. This is changing, but this mismatch remains an obstacle for moving beyond opportunistic engagement with institutional investors. As a result, some funds specializing in clean energy and low carbon infrastructure investment have emerged to act as stewards of institutional dollars. But will this be enough to really jumpstart institutional investment into solar projects? Asset-backed securities hold the key to bringing institutional investors on board In reality, institutional funds are not going to become big players until a market emerges that can bundle clean energy projects into securities and match institutional investor appetite. And given the predictable cash flows generated by solar projects with long-term PPAs interconnected in stable markets, these projects may actually lend themselves well to forming relatively low-risk, transparent, cash-generating securities. The key here boils down to risk mitigation. When a portfolio of solar project cash flows are pooled into one fund, that fund serves to protect the investor from the developer/sponsor’s corporate risk, which allows for standardized securities to be issued against the capital in that pool. Then, investors have a tradable security through which to commit capital to solar infrastructure investment. If these securities are well received in the market, they can create a virtuous cycle of demand-pull for the underlying asset, in this case solar. Beware: this virtuous cycle also occurred for the housing industry in response to mortgage-backed securities, so this positive feedback can have distortionary impacts on the market as well. At least presently, the solar industry does not seem to invite the same overzealous market speculation that threw the housing industry into a downward spiral. So, are we seeing the emergence of clean energy-backed securities to help leverage institutional investor capital? To some degree, the answer is yes. We can see this primarily in the rise of the green bond market. Bonds as a debt instrument, generate a contracted cash flow, which can back a security. The global green bond market grew to over $40B in 2015, a portion of which was asset-backed securities used to finance aggregate portfolios of smaller debt facilities into institutional investor-sized offerings. But there is a lot of work to do on expanding clean energy finance beyond the bond market. So, keep a lookout for innovations in solar securitization, as it holds the key to attracting institutional investors. Related data points:
Further reading:
The post-mortem reports are coming in droves as SunEdison prepares to file for bankruptcy. There are many diagnoses of the fall of this giant, but the common thread running through all of them is that SunEdison wanted to become the preeminent market force in the solar industry, but lacked the patience to build to that stature without burdening the company with excessive risk. And that risk, largely in the form of over-leverage, has come back to bite them in a big way.
Until the last year or so, it seemed as though SunEdison was the most prescient player in the market. They took advantage of historically low interest rates to use leverage to build and acquire solar assets at an unprecedented pace. Of course, revenue growth could not keep up with the accumulation of what became nearly $12B of debt by 2015. It was a classic market share play gone awry. By the time they committed to this path, the solar industry was likely not large enough to accommodate the growth expectations baked into their corporate strategy. They had to start acquiring anything and everything, often through massive overbidding for projects, which further cut into their increasingly small margin for error. As a result, they have been hemorrhaging EBITDA since 2012. But, hey, Amazon did the same thing for years. The only difference is that this model does not work in infrastructure companies dealing in hard assets. Growth at all costs is not a sustainable strategy When you start on the growth hamster wheel, it is hard to find an opportune moment to get off. In order to maintain the illusion that SunEdison was still a financially sound company with healthy growth prospects, it had to double down time and again on their acquisition strategy, ultimately culminating in the failed attempt to acquire Vivint. That marriage was always going to be an awkward one, but it still lent SunEdison the air of being the most ambitious behemoth in the market, and maybe adding Vivint to the increasingly diverse cauldron of business lines could conjure something greater than the sum of its parts. But the convoluted amalgam of yieldcos and mergers only widened the breach in the hull. This has all come to a head with the proliferation of recent news that suggests that SunEdison has long been in internal panic mode. The Vivint deal was never consummated, and a nasty lawsuit is on the horizon. The relationships with Terraform Power and Terraform Global are as tenuous as ever, various executives have left (of their own volition or not, who is to say), and there are a number of investigations into the accounting and financial reporting practices at the company. SunEdison’s debacle is an anomaly, but still serves as a cautionary tale There is no telling how the bankruptcy proceedings will play out, but it is certainly going to entail a massive sell-off of SunEdison’s assets to pay off creditors. This has already started in India, where they recently announced 450 MW of projects for sale. Whether SunEdison can emerge from the wreckage with anything intact is anyone’s guess. And whether there was actual merit in their growth strategy is also a point of contention. You can add SunEdison to the Abengoa’s of the recent past—cautionary tales in how growing too big, too fast, and with too sprawling and risky of a corporate strategy can lead to truly fantastic collapses. The naysayers may point to SunEdison as evidence of some underlying weakness in the value proposition of solar for large developers and investors. But when you look closely at the autopsy, you can see clear signs that this giant was destined to fall under the weight of over-leverage, rapid expansion into risky markets, suspect acquisitions, and perhaps a bit of hubris from management. In the backdrop of the sensational demise of SunEdison, companies such as First Solar and SunPower have been excelling in the current market environment. In our previous monthly reports we have focused on state solar policies. Our research indicated a growing trend among state legislators and regulators to review, amend, and in several cases, phase out or even cancel solar incentives and long-standing, proven solar policies. Although this process could be viewed as a natural regulatory action in response to a market reaching maturity, it has nonetheless taken its toll on the solar market. After the Nevada Public Utility Commission’s controversial December 2015 decision to slash net energy metering, many residential solar installation companies halted operations in Nevada, with giants like SolarCity and Sunrun exiting the state. Similarly, Michigan’s legislature is considering a change to its solar policy that will reimburse generators at wholesale rather than retail rate, making the state’s thriving solar industry nervous. In February, Massachusetts reached its net metering and REC caps, halting operations of solar developers and installers in a state that has more solar jobs than any other state except California. And North Carolina’s lucrative solar tax credit is set to expire at the end of this year, creating uncertainty and concern among local industry players in one of the nation's largest solar markets. Policy uncertainty is never a good thing. However, what many state-level regulators and legislators tend to forget is that keeping policies unchanged is not enough; to continue to grow, the solar industry needs certainty as much as it needs stability. In a constantly changing regulatory environment, threats are almost as much of a problem as actual changes. Initiatives to review or amend policies, increase rates, or decrease incentives make investors wary of new investments, thereby escalating the cost of raising capital. Thus, while DC legislators have contributed their share to the national effort to create certainty and stability in the solar market, state legislators are failing to do their part. This is rather sad news for the solar industry that celebrated the ITC extension, but relies on states’ policies to continue driving investments in solar energy. Indeed, renewable portfolio standards account for more than 50% of investments in utility solar, and net energy metering is considered the main driving force behind residential rooftop solar. However, it is not all grim for the solar industry. Despite the uncertainties from state to state, the industry continues to grow. The quarterly SEIA/GTM Research U.S. Solar Market Insight report for Q4 2015, released in early March, predicts that the solar market will grow 119% in 2016. As in previous years, most of the projected added capacity is attributed to utility scale installations. But if many states are not providing the stable regulatory framework required for a healthy business environment, where is this substantial projected growth in utility scale solar coming from? Before Congress extended the ITC, the 30% tax benefit for solar installations was set to drop to 10% on January 1, 2017, and to expire in 2018. This tax cliff created an incentive to bring as many projects as possible online before the 2017 drop down, thus driving the unprecedented expected growth in 2016. Utility scale installations require long planning and development, so although the ITC was extended last year, it was too late for players to react to the new tax environment. This is why installations in 2017 are expected to fall significantly, while commercial and residential PV will be less affected. The effect of the ITC extension on the different solar sectors can be seen in the graph below. U.S. PV Installations With and Without ITC Extension, 2010-2020 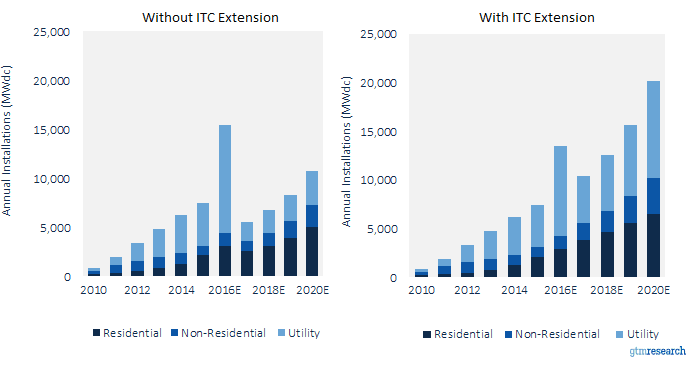 (Source: GTM Research) Moreover, there is another federal framework that drives investments in utility scale solar. Unbeknownst to many, the federal Public Utility Regulatory Policies Act of 1978 (PURPA) is gradually emerging as a useful tool for utility scale developers in a post-RPS world. Enacted in response to the 1973 energy crisis, PURPA imposes a mandatory obligation on utilities to purchase renewable energy from “Qualified Facilities” (QF) at the utility’s avoided cost. To meet the requirements for a QF, an energy-generating facility must not exceed 80 MW and its primary energy source must be biomass, waste, geothermal, or renewable resources. With prices per megawatt-hour in the $40 to $60 range, utility solar is at cost parity with natural gas, making it a strong competitor in PURPA’s avoided cost markets. In 2015 over 500 MW of PURPA-driven projects came online in North Carolina, and states like Texas, South Carolina, Utah, Oregon, and Idaho are also leading the way in utilizing PURPA for utility scale solar. States With >50 MWdc Non-RPS Utility PV in Development 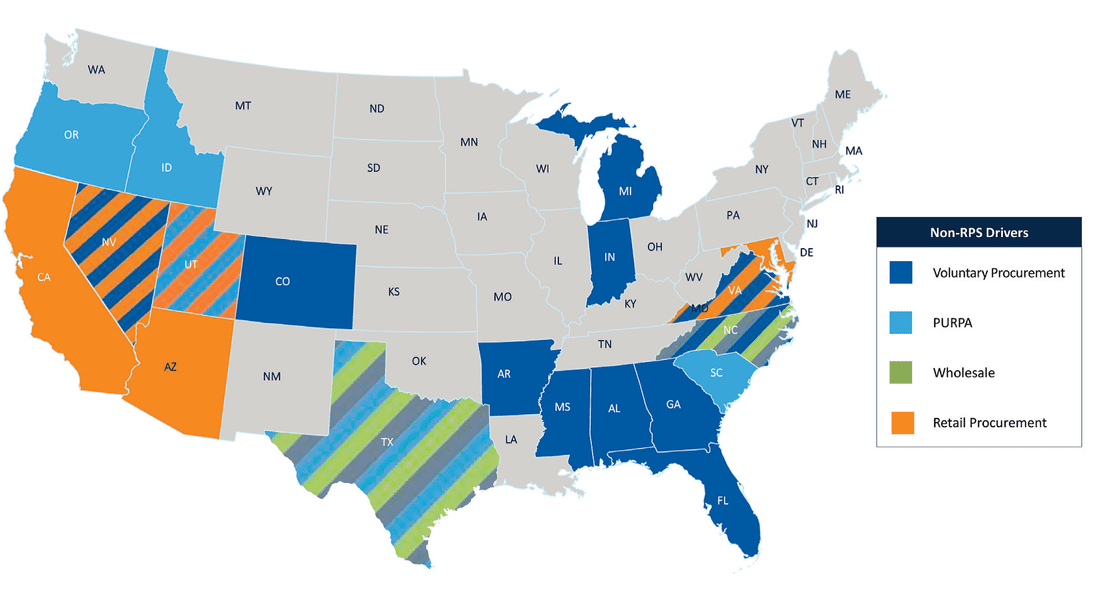 (Source: GTM Research)
As a federally mandated purchase, PURPA solar projects are not subject to state solar caps. Moreover, FERC regulations define “avoided cost” as the incremental costs to an electric utility of electric energy, capacity, and environmental externalities fees which the utility will incur if not purchasing electricity from the QF. The broad definition of “avoided cost” allows more facilities to enjoy QF status. However, despite the seemingly positive outlook for PURPA’s potential for solar developers, one must remember that it is very hard to enforce a PPA on a utility that does not want to enter one. One way of deterring QF developers from engaging with uninterested utilities is to propose terms and conditions that are more onerous to the QF than to non-PURPA counterparties. While FERC has succeeded at curtailing such practices, bad faith negotiation tactics are hard to prove and only few developers are willing to pursue costly litigation in an effort to obtain a PPA with an obstinate utility. To reduce transaction costs and assist smaller developers in negotiating with utilities, certain states have adopted standard contract rates for QFs of up to 10 MW (California up to 20). The standard contract makes it nearly impossible for utilities to avoid purchasing electricity from QFs. It is therefore not surprising that utilities in leading solar PURPA states are requesting utility commissions to reduce standard rates contracts caps. Late in March, the Oregon PUC approved Pacific Power’s request to reduce the eligibility cap for solar generation at QFs to three from ten MW, and a similar motion by Duke Energy was rejected by the North Carolina PUC late last year. As the price for solar generation continues to drop, we are expecting to see more PURPA driven PPAs across the nation. Whether PURPA PPAs will provide the necessary certainty and stability the market is currently lacking depends on FERC’s willingness to enforce its rules on avoided cost mandatory purchases, and Public Utility Commissions’ ability to withstand utility pressure to reduce standard contracts rates caps. Energy storage offers too many behind-the-meter benefits to consumers and grid operators to not become a common, if not essential, part of commercial PV projects. The myriad benefits of energy storage validate the basis of a beloved food analogy: “Energy storage is the new bacon—it makes everything better.”
The consumer-centric benefits are the most widely discussed, and they usually focus on shaving peak demand by reducing costly demand charges for commercial customers. In addition to mitigating demand charges, solar plus storage allows end users to benefit from time-of-use bill management, backup power availability, and increased PV self-consumption. Moving up the food chain, utilities can use energy storage to achieve resource adequacy, transmission congestion relief, and transmission deferral. Finally, Independent System Operators, or ISOs, benefit greatly from energy storage predominantly by increasing frequency regulation, but also via voltage support and energy arbitrage. PJM’s Atlantic-coast-to-Illinois territory became the first ISO to provide monetary incentives ($40-$50 per MWh) for grid-scale storage that directly addresses frequency regulation. On a related note, let’s talk about those scary “death spirals.” The U.S. energy storage market will be 8 times bigger in 2020 than it was in 2015, reaching 1.6GW of installed storage capacity. By 2020, the utility death spiral will have fully taken hold and grid defection will be occurring all over the country, right? I think not. In 2014, I contributed to a Rocky Mountain Institute paper called The Economics of Grid Defection, which seemed to briefly serve as a crystal ball for the nascent energy storage industry. But no more than two years after the report was released, even a modest amount of grid defection seems highly unlikely given the proactive efforts by utilities nationwide to design pilot projects and sustainable policies that integrate solar plus storage with existing grid infrastructure. The energy storage market will begin to resemble more of a shared economy rather than an increasing number of grid-defected silos. The availability of storage devices, both directly from the ramped up manufacturing as well as second-hand batteries from electric vehicles, will provide a sustained supply of storage assets to expand grid storage capacity. These are both compelling sources of affordable storage assets, and certainly a reason to believe the repeated headlines regarding anticipated drops in energy storage costs. The solar plus storage revolution is being driven by cost effectiveness and scalability, two key drivers that provide a strong signal for future growth. Navigating murky waters: Accessing the ITC for solar + storage projects It’s inevitable that developers compare the benefits of energy storage to the well understood benefits of solar PV systems. The reality is that the technology for deploying and optimizing energy storage is much more complicated than solar, which impacts the bankability and clear financing strategies needed for exponential capacity growth. Prioritized revenue streams from solar plus storage projects include basic kWh production from PV, in addition to the benefits derived from stored, dispatchable electricity when rates are peaking to shave off much more demand charges than solar could have ever done on its own. Aside from contracted revenue from the end user, determining the ability for solar plus storage projects to qualify for the 30% ITC (Investment Tax Credit) is a critical factor for getting projects to hit desired investment return thresholds. Solar plus storage installations qualify for the 30% ITC, but developers need to pay close attention to system design to ensure that the intended cost basis appropriately applies to the ITC’s rules and regulations. A few key insights include:
|
sign up for ironoak's NewsletterSent about twice per month, these 3-minute digests include bullets on:
Renewable energy | Cleantech & mobility | Finance & entrepreneurship | Attempts at humor (what?) author
Photo by Patrick Fore on Unsplash
|

© 2009-2022 IronOak Energy Capital, LLC | (888) 249-3013