
|
11/5/2019 Outcompeting lithium-ion in the 2020’s — Which new energy storage technologies might win?Read Now
 By: Chris Wedding, PhD “You miss 100% of the shots you don’t take.” Depending on whether you are from the South or the North, you’ll think that quote was attributed to Michael Jordan or Wayne Gretzky. With two degrees and a professorship at UNC Chapel Hill, I’m definitely going with MJ. Regardless, this pithy wisdom applies to our topic at hand — Innovators that harnessed blood, sweat, tears, and billions of dollars to shoot for the moon with bold battery solutions that did not work out. The silver lining (or maybe it’s lithium) is that those were the early days. And it’s better to gamble with pennies than with gold. Going forward through 2040, Bloomberg projects $620B to be invested in the battery sector. That’s a frighteningly large amount of capital. So we better learn lessons from those early failures and invest these dollars intelligently. First, a review of why batteries are wonderful... Below are three figures which tell a compelling story. #1 The 13 benefits that batteries can create for building owners (behind the meter), utilities (front of the meter), and grid operators (e.g., Independent System Operators). — Source: RMI 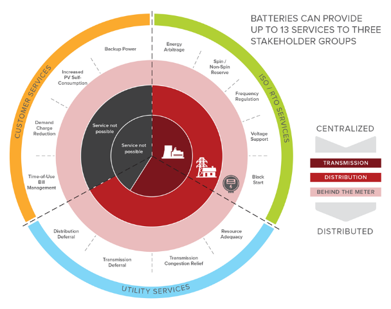 #2 The surprising growth of residential energy storage installation in the U.S. — Source: GTM Research / ESA U.S Energy Storage Monitor 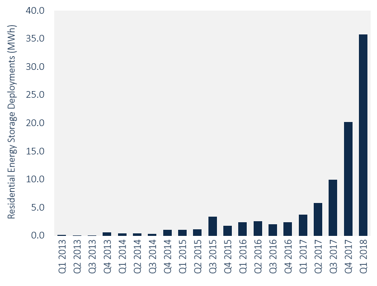 #3 Areas of the U.S. where commercial and industrial energy storage can produce an attractive return on investment today, not in some distant future where Elon Musk is the next billionaire president. — Source: NREL 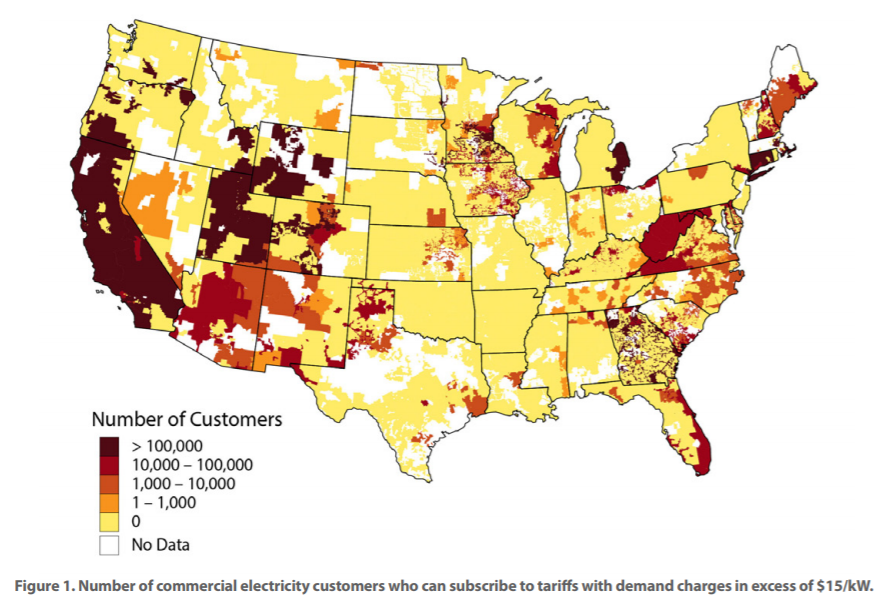 And now, a list of battery companies “with arrows in their backs” The following companies were cutting edge, but the cuts went too deep. God bless them for being innovators that were too early. A123 Systems
Alevo
Aquion Energy
Better Place
Fisker
In aggregate, these companies raised more than $5B from smart, accomplished, and connected investors, such as the following:
Sources: Pitchbook, Crunchbase, Greentech Media, PV Magazine, VentureBeat, and the New Yorker Finally, 10 lessons for “keeping your shoes clean in a cow field” #1 Focus. Focus. Focus. — Some battery manufacturers tried to serve multiple markets and geographies, across both stationary (power grid) and EV (electric vehicle) sectors. You have to pick. Say no. You’ve heard it before: “If you try to please everyone, you’ll end up pleasing no one.” #2 Vet storage technologies the way that investors vet energy project investments — This matters because ultimately tech needs to scale into deployments. Below are six questions to ask of a battery technology and company:
#3 Apply the pre-mortem — Watch for “froth.” If all investors are in love with the company, ask why it could fail. Once you identify the flaws, ask whether there are risk mitigation strategies, and if you believe them. Ignorance is not bliss. #4 Manage burn-rate like a hawk — Raising a big round, or being on a rocket ship based on confident financial projections are not excuses to spend too much. Pretend your dad was a CPA like mine. Make sure a board is in place and that they firmly hold the executive team accountable, without applying a death grip. #5 Compete against the giants with your eyes wide open — If the battery technology company wants to oust lithium-ion batteries from their global dominance, then get ready for a long, uphill battle. Granted, at the top of that hill, you might see a pot of gold waiting. But you may have aged a decade in the process. Or maybe instead you should just climb a different hill: Find a niche use case where lithium-ion is not the answer. Find its weakest performance parameter, innovate to excel on that same attribute, and then find the one customer segment in a specific geography that loses sleep over that problem you could solve with a non-lithium-ion solution. #6 Don’t depend on business-to-customer sale channels — As individuals, we are fickle, distracted buyers. Businesses are not. They seek what’s best for them and buy in large quantities. Find battery companies that make businesses happy. Then sell to them in order to reach your ultimate customer, whether it is the business or that business’ customers. For example, make the utility or auto manufacturer your friend, not your foe. #7 Partner with strategic investors — These guys (and gals) provide three benefits: (1) They might be more patient with their capital, allowing time to maximize company value before exiting an investment. (2) They can provide fantastic validation that the storage company has market potential and may indeed scratch their own itch. (3) They can be extraordinary customers that “make the business,” adding serious revenue through large contracts. #8 Raise capital before you need it — Plenty of companies run out of cash before they raise their next round. This was also true for some early stage storage startups. Don’t depend on cash flows for growth too early on in the business. Raise more than you think you need, share the pie, and earn the opportunity to watch it grow. #9 Prioritize capital-light business models — If the battery company wants to use lots of venture capital to build factories, run away. Far away. Instead, contract manufacturing, creative lines of credit, and supportive supply chain partners can reduce capital cost needs. In addition, it always helps to invest in the “brains” of the storage devices. Get some intellectual property, some software, and some automation. #10 Good looks alone won’t cut it — Cool design can’t overcome poor quality or inconvenience. That said, ugly form factors can also be recipe for inducing yawns if there is any consumer component to the sales cycle. Find the balance. But keep your eye on the target: High performance. In conclusion… I’ll conclude with a relevant metaphor that takes me back to my days in Kentucky... We’re off to the races. Don’t be too late to make that bet. Pick your jockey(s). Pick your horse(s). The prize money is much more than a bucket of oats.  By: Dr. Chris Wedding, Managing Partner In the last quarter, investors poured more than $324M into blockchain for energy companies. Can you believe that? Well, you shouldn’t. But which part is most unbelievable? While $324M seems shocking, it’s all about context. That amount has indeed been raised, but it’s taken 12 months to do so, according to GTM Research. What’s more shocking is that over 75% of this capital has been raised via Initial Coin Offerings, or ICOs. When thinking about this emerging market, it’s kind of like being back in high school: Some investors have FOMO (Fear of Missing Out). But others think they’re too cool to hang out with the kid who just became popular after years of dork-dom. But what should you, oh wise capital providers and ye capital-hungry blockchain entrepreneurs who worship the clean energy gods of purity, know about blockchain-focused energy opportunities? Here are our top 4, out of our longer list of 75. (I exaggerate slightly.) 1. There are 120+ blockchain energy companies. But most are relative newbs. Yep, that’s a term from my kiddos. I can’t wait to finish this blog so I can go tell them I used their word correctly. But do I use the word “newbs” to be mean? Heavens, no. I’m a good Catholic-Buddhist, after all. (Oh, they exist.) What I’m referring to is the age or maturity of most companies in this sector. Research from Solarplaza suggests that most ventures were formed in 2016 or 2017, and investors at the GTM Blockchain Forum note that most founders have little to no operational business expertise. That does not mean that these young ventures lack merit. But it does make the hill to success tougher to climb. (Think steep slopes covered in poison ivy and man-sized Venus flytraps.) As Greentech Media’s Chairman observed [paraphrase]: “We see many white papers for ICOs sponsored by blockchain in energy startups. Some are are interesting. But some are sketchy.” Another panelist at a recent blockchain energy conference noted: "We're currently working with Atari, but we need to be using Playstation 4 to make most [blockchain for energy use cases] work at scale.” An investor panelist put it another way [paraphrase]: “Blockchain is today where the Kardashians were in 2008. When their name is on something, it can print money. But then smart people ask ‘Why? What businesses do they really have? Maybe a clothing line, a home video business (get it?), and a few others?’ But then you realize there is a genius marketing mastermind behind it all. The hype is, in fact, part of the cause for success.” Lastly, all hail innovation. Seriously. This is how it works: First, divergence. Second, convergence. However, we’re very far from the latter. 2. There are a bazillion use cases. And the energy world is 6-trillion-dollars big. Just in case you thought that 120 companies in the same emerging sector was a lot, think again. The Energy Web Foundation, co-led by our friends at the Rocky Mountain Institute, see over 200 potential uses cases for blockchain in energy. Even if only half of those scenarios prove to be real, that is still many, many niche markets ripe for multiple companies to do well in many geographies. Moreover, the energy industry is not a tiny pearl hiding in a small oyster. It’s more like an ocean full of 100-foot long blue whales, as plentiful as squirrels on a college campus. But seriously...no wine glass in hand...The energy market is one of the biggest industries on the planet, and it’s full of intermediaries that control the flow of electricity and money. This creates a huge playground for diverse and interoperable blockchains, distributed and trusted ecosystems of counterparties, and automated and smart contracting abilities.  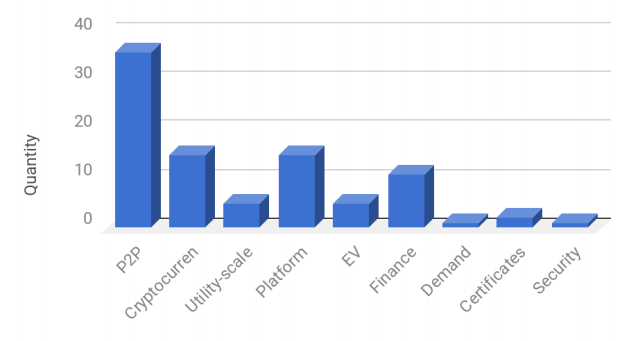 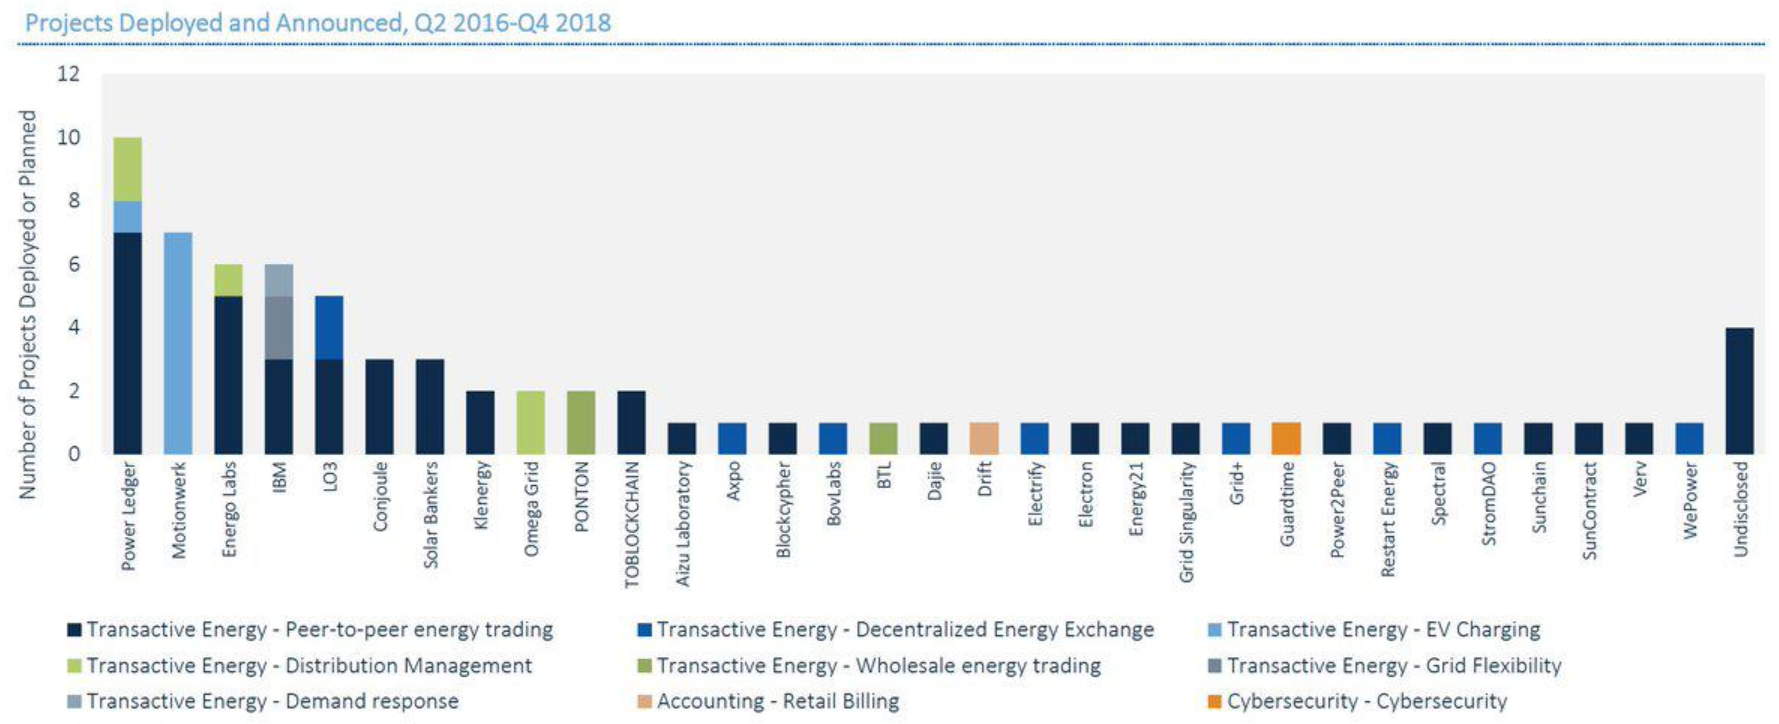 3. ICOs are crushing equity investors. But that can (should?) not continue. In the broader universe of early-stage blockchain companies, ICOs are killing venture capital. I mean, like the Incredible Hulk vs. me in a boxing ring, or some such awful mismatch. However, the U.S. Securities and Exchange Commission is taking a pretty hard look at ICOs — in the past, present, and future. And let’s just say that their eyebrows are raised, you know, where one is raised higher than the other. While many ICOs have tried to avoid SEC oversight, when it walks like a duck and quacks like a duck, then...It’s a security. (If you don’t know what I mean, take a look at their guidance here.) All is not lost for conventional equity investors. Venture capital and corporate strategic investors bring value that can be far greater than capital alone. (The latter is the extent of the contribution from ICOs.) The other benefits of working with institutional equity investors include rich networks that can lead to partners and customers, insights on corporate governance based on lessons learned from dozens of past ventures, and deep sector expertise to allow for threat and opportunity recognition beyond what the core team might focus on while their heads are down building a company. 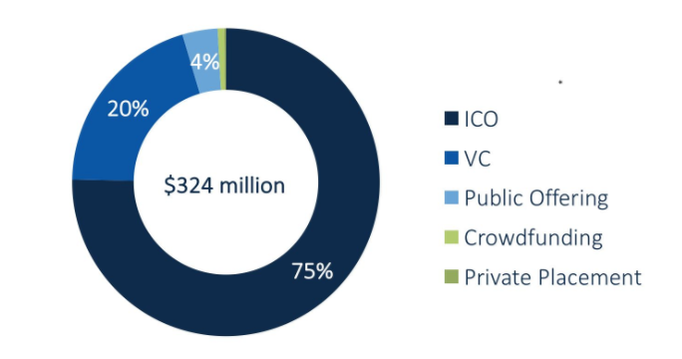 Capital Raised for Blockchain Companies: Q3 2016 to Q4 1017 Equity (blue) vs. ICOs (orange) Source: CBInsights, Tokendata 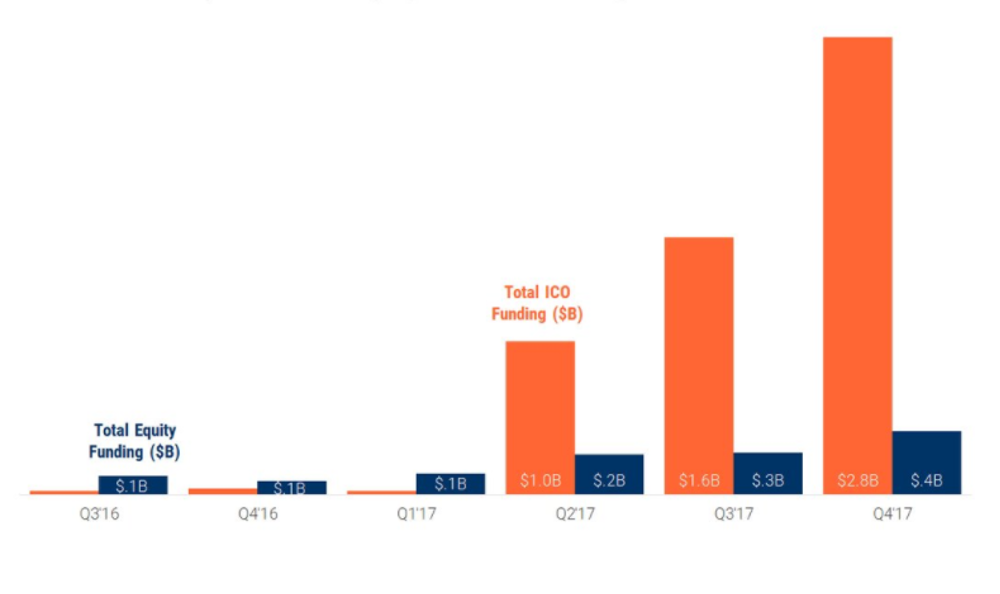 4. Blockchain is not just for nerds. It’s for the C-suite.
Some famous venture capitalists have said that they look for the next big investment opportunities by watching what scientists, engineers, and other smart folks are doing outside of work, perhaps late at night or on the weekends. Blockchain may have started out that way. But today, it’s a topic that rises up to, or comes down from, the highest level in organizations — the C-suite or the Board of Directors. Why is that? One guess is that they see blockchain as a disruptive innovation focused on challenging core competencies and going outside of the box to amplify corporate synergies, finding opportunities in AI, and gobbling up low-hanging fruit. Just kidding. I was trying to use as many meaningless buzzwords as possible in one sentence. But the reality is not too far off: The top level of management is charged with finding and responding to risks and opportunities that lurk further out, beyond the blocking and tackling of tactical business execution, metaphorically crouching behind a dumpster to surprise the marathon runner in mile 20. Wrap up, Part 1: What are some things that investors love about blockchain? Blockchain-based energy companies can be attractive because...
Wrap up, Part 2: What are some attributes that investors hate...ur...worry about blockchain-based energy ventures? Investments in blockchain-based energy companies can be challenged because...
Conclusion: Is there one? OK, so like many emerging sectors for investment, there is plenty of risk and reward. But as they say, “Sitting on the sidelines is no way to win a game.” (Can you tell that it’s almost March Madness. I grew up in Kentucky and am a professor at Duke and UNC, so go blue!) As IBM put it in a recent Tweet, “We do not know where #blockchain will go, but there is a need to jump on board!” Let’s be clear about one thing. It really could have been you.
You knew about cryptocurrency way earlier than your friends. You could explain blockchain to your grandmother in less than 60 seconds. But you did not pull the trigger. Some hint of disbelief that something so newfangled and profoundly nerdy could not take over our collective financial imagination. So, here you are today with a severe case of FOMO, watching cryptocurrency values skyrocket (and plummet and skyrocket again), and your 20/20 hindsight dreams of overnight millions squashed. We are all feeling it, though funny enough, the ones that are feeling it the most are probably the ones that did invest and are riding that roller coaster up, down, up, up, down, up. Why didn’t I buy more!?!? $1,000 dollars invested in Bitcoin in 2013 would be over $300,000 today (though this could easily spike or plunge 25% just while I am writing this piece). The agony! As of this writing, Bitcoin had lost more than 60% of its value since its peak at over $19,000 in late December. Heed the crash and avoid Bitcoin like the plague, or buy low as smart investors do during an overcorrection? Again, the agony! An unintended consequence of the fervor around Bitcoin, as well as some other popular cryptocurrencies like Ether and Ripple, is the new public debate about the potential of blockchain to disrupt (!) industries other than just the financial sector. Any industry that is founded on the flow of information and money qualifies, so that’s basically everything. But is blockchain a panacea, destined to democratize data and money, all the while disintermediating the entrenched intermediaries that dominate the global economy? Of course, there are camps firmly planted on both sides of that debate. I am not here to stake my flag on one side or the other. Rather, I aim to take a sober view of where blockchain may actually be the revolutionary technology that it is touted to be, and where it fails to live up the hype. Before we get started, there are any number of awesome explanations as to what blockchain is - see here (PwC) and here (IEEE) for two of my favorites. Here is my heroic attempt to distill blockchain to its bare bones essence:
That sounds kind of revolutionary, so what am I missing? At its core, blockchain is most suitable in contexts in which data transfer (communication) is challenging, trust and privacy is highly valued, and data security is paramount. Again, this sounds like virtually everything that takes place on the Internet. This comes to bear primarily in two places: (1) the increasing number of unwieldy, siloed data systems that are highly susceptible to cybersecurity issues (e.g., see here for the 17 biggest data breaches in the 21st century) and (2) markets that are hampered by unnecessary inefficiencies, limitations, and complexities due to costly intermediaries. Seen through this lens, the energy sector is an excellent test case to take a deeper look into potential applications and pitfalls of blockchain technology. Sounding the Emergency Horn for Energy Monopolies The electric grid is arguably the most impressive technological achievement in the modern world. At the very least, it is certainly one of the most impactful to our everyday lives. The extraordinary cost and complexity of the electric grid initially lent it to monopoly protection by governments seeking order and control over its development and management. The last several decades have seen the unraveling of the heavy regulation supporting electric utility monopolies in many areas of the world, which have given way to more competitive markets in which many different types of energy providers, generators, and other service providers vy for customers. This has opened the floodgates to a much more diverse set of actors engaging in energy transactions via the grid, yet antiquated regulation and entrenched utility interests still limit the ways in which producers and consumers can transact for power and energy-related services, especially micro-transactions. Blockchain applications in the energy sector are positioned squarely at the crossroads of deregulation and the empowerment the market participants (e.g., consumers, prosumers, generators, etc.). Consumers and producers can form a more direct relationship with each other using blockchain technology wherein smart contracts (very smart) are used to transact for power and other grid services. As direct procurement and contracting scales, the role of the electric utility may be relegated to managing the transmission and distribution infrastructure, which, in many markets, would be a significantly reduced role in the functioning of the market. (Gulp.) This simple example may naturally lead you to conclude that peer-to-peer (P2P) energy trading is the inevitable future for the energy sector. Imagine you have excess rooftop solar generation you would like to sell your neighbor across the street -- the blissful life of the prosumer. This fanciful scheme is actually being tested and enacted in a small number of demonstrations. However, for reasons that we will get into shortly, P2P energy trading is neither the most likely nor nearest-term viable application of blockchain technology. Where Blockchain Finds its Groove in the Energy Sector Let’s start with the good news. The ballyhooed explosion of cryptocurrencies, which has fueled the popularity of blockchain, is not the only game in the energy sector. There are a wide range of applications from energy trading (e.g., grid management, microgrids, wholesale and P2P trading) to asset management (e.g., data collection and processing) to renewable energy certificate tracking to mobile payments (e.g., electric vehicle charging), among many others. To say that there has been an explosion of emerging companies in this space in recent years would be an understatement. But how many companies have a legitimate product, and, importantly, a viable market application with willing [and ready] customers is an entirely different question. Most energy and blockchain companies still bask in rose-tinted fields of possibility, while precious few have deployed a commercial product beyond demonstration projects. Not to despair, we are still in the early stages. But neither does that mean that this process of innovation and experimentation will inevitably lead to a wholesale disruption (!) of the electricity sector. As with many prognostications (especially related to technological innovation), please take my ranking of energy + blockchain applications in order of their long-term viability and timing to market with the requisite grain of salt:
Check out SolarPlaza’s comprehensive guide to companies in the energy + blockchain space. The World Energy Council takes a different tack with their energy + blockchain use case taxonomy. While certainly extensive, I am relatively certain both of these excellent resources have missed some under-the-radar companies and sub-sectors that will emerge in the coming months and years. That said, it is no small task to track this rapidly evolving space. The bottom line is that blockchain may not be a panacea, but it certainly could be part of an enabling technological solution to drive the transition to a more distributed, digital, secure, and renewable electric grid. One of the more encouraging developments has been that blockchain has not only unleashed a wave of innovation at the startup level, but also inspired the formation of a number of non-profit consortia working in collaboration to support the energy + blockchain space. The Energy Web Foundation, HyperLedger, and Enerchain are among the most prominent efforts, each of which is backed by the who’s who of corporate behemoths. So, pick your favorite energy technical challenge (as if I had to even ask) and keep up with the rapid pace of progress. Energy-backed Cryptocurrency Beat Down As we started on this journey, I led with the remarkable explosion of interest and speculation in the cryptocurrency markets. To be clear, this is by no means limited to cryptocurrencies that you could recognize by name -- Bitcoin, Ether, Ripple, etc. Various market tracking websites list over 4,500 cryptocurrencies worth nearly $500B. To put that in perspective, the US Gross Domestic Product (GDP) is a bit over $18T, which means that the global cryptocurrency market is valued at over 5% of the US economy. (You can thank me later for that bit of cocktail chatter.) If you want to kill a couple of hours, take a look through some of the more esoteric cryptocurrencies, and your mind will be blown at the number of completely ridiculous schemes underpinning these financial instruments: Coins to gain VIP entrance to Las Vegas strip clubs to coins that allow you to buy objects in video games. This explosion of cryptocurrencies are a true testament to human ingenuity. At least one cryptocurrency plainly states that it is merely a means for guileless investors to give them money for nothing. Kudos for the honesty. In the energy space, there are a number of attempts to use cryptocurrencies or tokens as a medium of exchange for power and other energy services. The general proposition is that a coin or token is minted by a company, which confers upon the owner the right to some future consumptive good. A simple example would be a coin could be exchanged for X kWh of electricity generated by a solar farm. Sounds pretty simple and compelling, right? Upon deeper inspection, a number of key friction points become clear. First, these coins presuppose that an independent exchange functioning separate and apart from the existing energy markets can arise magically out the much lauded network effect. More consumers demanding, purchasing, utilizing, and trading coins, and more producers generating electricity in exchange for coins, selling those coins for other cryptocurrencies, and then monetizing those cryptocurrencies outside of the exchange. A producer generates electricity and exchanges the right to consume that electricity for a coin. That coin gets purchased with another more liquid cryptocurrency like Bitcoin or Ether, which can then be exchanged for a fiat currency like U.S. dollars that has exchange value for other goods and services in today’s economy. A consumer buys the coin with their Bitcoin, Ether, etc., and then can either consume the services underpinning the coin (e.g., electric power in many cases), hold it, or trade it to someone who places an even greater value on those services. Now, the real magic lies in believing that transacting for kWh’s of electricity in this exchange will be an overall better proposition for the producer. In other words, will the producer be able to generate more revenue with a similar or greater degree of predictability using some energy-backed coin or token compared to more conventional methods of either project finance using long-term power purchase agreements (PPAs) in the case of standalone renewable energy projects or net metering in the case of rooftop solar on homes? The answer is anyone’s guess. But there are certainly blockchain-based energy companies banking on producers flocking to alternative forms of project finance or market compensation. There is a part of this puzzle which simply does not make sense. Imagine you have the opportunity to make a wager based on the future value of a kWh of electricity. How bullish are you that kWhs in the future will be worth much more than they are today? History would indicate that electricity prices do not tend to skyrocket in value in well-functioning markets. In the renewable energy space, electricity prices have plummeted in recent years. So, why would someone invest in an energy-backed cryptocurrency if the ceiling is so low on the value of the kWs of electricity backing the coin or token? From the issuer perspective, part of the appeal of minting an energy-based cryptocurrency is that it is a means for producers to acquire other, more liquid cryptocurrencies which have seen extraordinary increases in value recently. This has had appeal with the growing speculative fervor surrounding Bitcoin, Ether, etc. without using any of your precious dollars. It is a classic arbitrage scenario for you economics nerds. Imagine, for instance, that you, the producer, generated one MWh of electricity, were granted some energy-backed coin, and exchanged it for 10 Ether on January 1, 2017. At the time, you got a great deal, as the value of the Ether that you received was around $80 ($0.08/kWh), better than what you could have gotten in the merchant markets or through a PPA or net metering agreement. You decided that it was not worth your while to exchange the Ether for dollars, and you just held onto it. Today, you looked at your digital wallet, and lo and behold, the 10 Ether that you received from the original one MWh that you sold is now worth over $8,000. In just over a year, you grew the value derived from that MWh by over 100x! What is not to like about that? But who knows what is going to happen with Ether (or any other cryptocurrency) over the next year? So how long can the dream last? For the consumer, there needs to be interest in directly consuming those kWh of electricity, but that will not likely cut it. In addition, the consumer will need to believe that the exchange value for the coin or token will have a future speculative value greater than the purchase price. That has been a relatively easy sell to date, but there may be a weakening of that foundation with the growing volatility in many cryptocurrency values in recent months. The bottom line is that many energy-related cryptocurrencies are, either directly or indirectly, betting on Bitcoin, Ether and the other dominant, liquid cryptocurrencies to continue this meteoric rise (and fall only to rise again) in value, which is driving this explosion of coins and tokens to get a piece of the action. Is that the basis of a healthy, functioning cryptocurrency exchange? Only time with tell... An Obligatory Word about Energy Consumption You energy conservationists out there may be exclaiming -- “But doesn’t blockchain use an exorbitant amount of energy to run?!” Not really, and certainly not for the use cases that we are talking about. The doomsayer prognostications of world energy consumption being dominated by blockchain largely revolve around a faulty extrapolation of energy consumption from Bitcoin mining. Even the NYTimes got in on the hyperbole, though CNBC had a more sanguine view. Not to slip down that slope, but the bottom line is that this is a symptom of an immature technology scaling exponentially. No right-minded person could have possibly anticipated the speculative fever that would envelope Bitcoin, which has fueled increasingly extravagant investments in energy intensive processing capacity to compete as a Bitcoin miner. This can and will be corrected over time, just like it has been for the Internet, which was consumed by similar criticisms during its early years. So, this is a bit overwhelming, yet how can I be among the smarter people in the room on energy + blockchain... With a healthy balance of enthusiasm and skepticism, it is well worth your time and effort to keep a tally on the energy + blockchain space. There will inevitably be a litany of failed companies, over-hyped experiments, and even a likely SEC regulatory backlash (see the SEC Chairman’s latest statement on cryptocurrencies and ICOs). Notwithstanding, there is literally no doubt in my mind the blockchain technology is here to stay, and will, in all likelihood, catalyze a lot of change in how energy is financed, produced, bought and sold. It will not change everything, and will certainly not do it overnight. Blockchain is in its toddler years. Stumbling about (think explosion of crypto-schemes, coins, tokens, etc.) and occasionally articulated a coherent word of phrase (think legitimate business value proposition). Over time, and with a lot of falling down and bumping heads (you can tell I have a young child), this little toddler will grow up into being a much more mature little person (even then with a lot of room to grow). Until then, just enjoy the ride (and heed the SEC when they say that things are about the change). Ah, to have a crystal ball and see this future play out.
Or better yet, to be a character in the movie Back to the Future. Also about futuristic cars, I might add. (If you don’t know what I’m talking about, go ask a super “old person,” like a 41-year-old. Oh how my kiddos define “old.”) Maybe you care about future growth estimates for electric vehicles (EVs) because you stand to win… For example, EV manufacturers, utilities that can better monetize sunk costs in power generation assets during off-peak hours, battery makers, NGOs working to protect human health, or lithium and other precious metal supply chains. Or maybe you care because you’re industry stands to lose, at least initially… For example, major car manufacturers, government leaders concerned about falling revenues linked to gasoline taxes, utilities unable to manage peak power challenges, or...um...the oil industry. Whatever the motivation, one thing is for sure… There is no agreement on how, when, or if EVs will come to dominate the transportation sector. And importantly, the same metric used for these EV projections is often not the same. It could be “percentage of new sales” or “percentage of total vehicles on the road.” Even trickier is the fact that calculations from various sources do not use the same year for the end state. Some use 2030, others 2040, and...well...you get the idea. It’s almost intentionally confusing so as to prevent an apples-to-apples comparisons among different EV projections. So, here are five things to keep in mind regarding the “all over the map” nature of future EV growth. 1. Calculations for EV expansion continue to be revised upward (more favorably) No one is perfect, and all estimates of future EV growth are wrong. As such, credible sources for these data frequently offer updated projections. Consider the US Energy Information Administration (EIA). Almost everyone considers this to be an authoritative source on energy trends, though many agree they have been conservative when envisioning (or being blind to) renewable energy’s rapid recent growth. (See explanation from David Roberts at Vox.) The US EIA’s vision for EV sales three months ago is 2x higher than one year ago, and 10x higher than its estimates from ten years ago. 2. Estimates for EV penetration by 2020 vary by 11x, depending on the source Consider the range of EV adoption from these trusted sources:
It’s also worth stating the obvious: The disruptive nature of EVs is significant enough that non-transportation management consultancies and big banks like PwC, Deutsche Bank, Deloitte, and BCG are spending time making forecasts to win new business in the sector. #NotaTinyNiche (Yep, Millennial readers, I’m so hip that I just dropped a hashtag.) 3. Non-proponents of EV (Fitch Ratings, big oil executives) are taking notice of its potentially significant impacts It’s not uncommon to hear the term “death spiral” in reference to utilities who face increasingly tough competition when electricity from solar plus storage becomes cheaper than grid power. But those statements, sometimes deemed hyperbolic, tend to come from renewable energy proponents. Biased, one might say. This time, it is instead coming from Fitch Ratings, one of the big three credit ratings agencies. Bloomberg summarizes below the takeaway from Fitch’s October 2016 report, Disruptive Technology: Batteries: “Batteries have the potential to ‘tip the oil market from growth to contraction earlier than anticipated,’ according to Fitch. ‘The narrative of oil’s decline is well rehearsed -- and if it starts to play out there is a risk that capital will act long before” and in the worst case result in an ‘investor death spiral.’” (link) And despite very conservative EV projections from BP and OPEC (see below), many oil executives are aware of EV’s impacts on the sector, and are, in part, noting a decline in oil demand starting in the late 2020s or early 2030s. But note: Though there are still critics who believe the coming EV tidal wave is totally overblown. Here is a good counterpoint from the Financial Times. For a deeper dive into how oil and gas majors are increasing their investment in renewable energy, check out our other article: “Oil and gas companies’ and renewable energy: Passing fad or major trend?” Also, check out this graph that represents the 120 EV car models coming to market by 2020. All of these car manufacturers bets on EV can’t be wrong, right? (Tongue twister, I know.) 4. EV market share by 2040 varies by 13x, depending on the source As you can guess, the potential for errors increases as the length of time in the projection increases. So, how do projections for EV penetrations vary for 20 years in the future?
And how about projections for EVs as a percentage of all new car sales?
Are you confused yet? Yep, me, too. But that can be the sign of a sector that presents opportunities for above-market returns. 5. Adoption of new technologies has historically happened quicker than common sense would suggest Consider the microwave, dishwasher, cell phones, refrigerator, internet, VCRs, or computers. They are not perfect comparables to a vehicle, but suspend disbelief for just a second. These technologies often went from zero to 80%+ market penetration within about 25 years after their initial 1% market adoption (i.e., roughly where EVs are today). This graph shows these trends well. Here are some assumptions you could use to create your own simple spreadsheet:
Potential results:
-- In conclusion When it comes to predicting the future role of EVs in the transportation or energy sector, no one is right. However, it’s a little bit like deer hunting with a bazooka. (Bear with me...I’m born and raised in the South.) It doesn’t require the precision of a bow and arrow, so odds are you’re going to be putting some free range meat in your freezer after that trip to the great outdoors. Translation: Abundant opportunities exist for entrepreneurs, large corporates, and investors in the EV market in the short and long term. As the Chairman of Bloomberg New Energy Finance noted recently, with 100+ EV models on the road within three years, EVs will make internal combustion vehicles look old fashioned. 1. Have no delusions about policy risk -- it exists, but it is not unique to the solar market It is not an uncommon stance for private equity investors to claim that they will not enter markets with “policy risk.” Being someone trained in economics, this statement comes across as somewhat strange, bordering on naive. Markets are policy constructs. There remains some secular ideal of a free market without government or policy intervention. While this may exist out in the far reaches of less formal economies, it is wholly inapplicable to electricity markers. The policy landscape defines the contours of where and what kind of solar development can take place and where capital can be deployed with the reasonable expectation that it can meet investor hurdle rates. Ignore policy at your own peril. The most enterprising investors are constantly searching for ways to anticipate markets movements largely through the lens of policy. That said, if there is anything that will put a damper on sustained investment activity, it is policy uncertainty. And that pertains to everything from state-level mandates to utility-level interconnection practices to local land use planning. While it is relatively easy to have a clear view of the state-level policy, it requires much more on-the-ground knowledge of utilities, permitting agencies, and landowners to really discern where the most productive spaces to invest are. 2. The states rights debate emerges in the electricity market It is easy to assume that the biggest energy-related issue at stake at the federal level is the Clean Power Plan. Of course, whether the CPP makes it through the Trump administration’s grinder is a matter of no small importance, but let’s just say the odds are not in its favor. It’s a shame, as the CPP was never really given a chance to shine (pun intended). There is a larger structural issue at stake concerning federal vs. state jurisdiction. States used to control most of the electricity market regulation, but has started to cede authority to FERC as the electric grid has become more regionalized, interstate electricity markets have formed, and and transmission development issues have cropped up. Yet again, the age-old story of federal vs. state rights comes to bear its head. States have lead the charge with RPS mandates, various compensation schemes for distributed resources such as RECs, implementation of PURPA, and a host of competitive policy issues. And, as any clever investor or developer knows, this has created a remarkably vibrant but fragmented investment landscape for solar in the U.S. FERC is left to argue over who is responsible for creating a coherent picture of this vast mosaic of policy approaches. Left to their own devices, states will forge ahead with their own plans and policies. But that will not necessarily suffice when trying to address regional and national resource adequacy, generation mix, and transmission concerns. Keep an eye out for more rulings on how the energy transition will be governed and regulated at the federal and state level. Especially for states that are behind the curve, so to speak, it will be really impactful on how utilities are regulated and where new emerging markets for solar development and investment emerge. 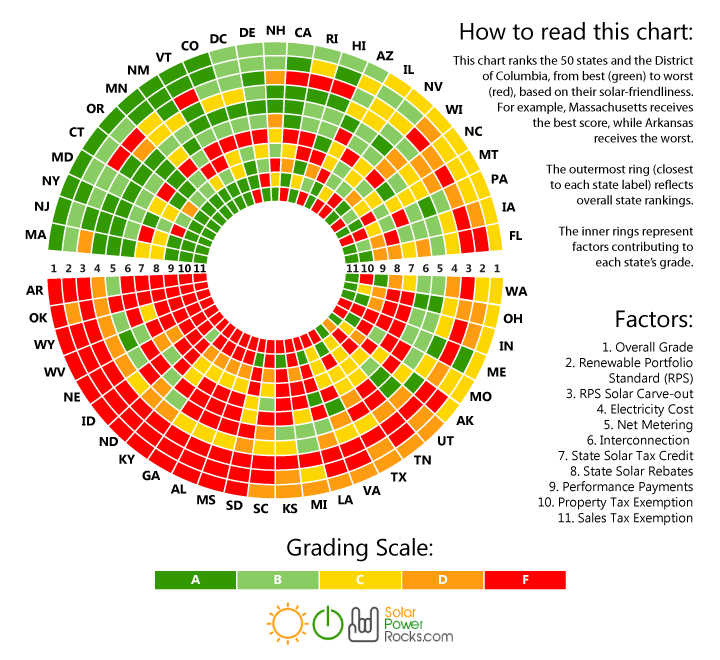 (Source: SolarPowerRocks.com) 3. Grid modernization is essential (and cool sounding), but it’s still going to be a bumpy road The New York REV program gets a lot of love, but don’t forget about California, Massachusetts, and Maryland, among others. Each is whipping up a unique secret sauce to address a docket of issues surrounding utility structures and incentives and the integration of distributed energy resources (DERs). At a high level, efforts such as these will ease the path to higher penetrations of renewables, a long-standing (and perhaps specious) contention of renewable opponents and skeptics. More importantly, these policy initiatives aim to create a more cooperative and predictable environment for developers to build projects and investors to deploy capital in the solar sector. Developers are always interested in more (low cost and patient) capital and high quality pipeline. But, increasing their Christmas wish lists include more certainty and predictability in navigating the increasingly gnarly regulatory landscape. If there is any simple heuristic for forecasting new solar markets, it is where grid modernization processes are underway. If it only were so simple. Where modernization makes developers and investors a little uneasy is how new DER compensation schemes are going to change the value of their development assets and operational projects. From a technical standpoint, it makes all the sense in the world to treat DER according to the value it contributes to the grid. By no means is this easy or straightforward, but there is some logic to doing it. But it is an entirely different matter to get investors comfortable with underwriting projects with significantly different revenue streams. Underwriting solar projects is something that the industry has become quite adept at, and there will be some reluctance in adapting to entirely new structures. If this comes to pass, and we are no longer in a solar world dominated by simple PPAs, then the most enterprising investors will need to lead the charge on how to finance these projects. 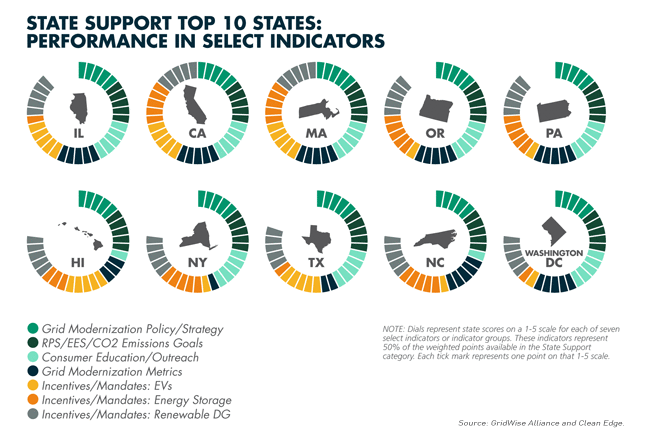 (Source: Clean Edge) 4. PURPA has been a cornerstone in the solar market, but watch out for potential attacks. The Federal Public Utility Regulatory Act, otherwise known by the attractive sounding acronym PURPA, far preceded the solar industry as we know it today. Dating back to 1978, this policy lay relatively dormant for many years before becoming a key driver of growth in small utility-scale markets in many states. North Carolina can attribute its high ranking in terms of operating solar capacity - #3 as of 2015 - in great part due to PURPA projects, also known as qualified facilities (QFs). For years, this had been perhaps the best example of a market with low policy risk because the law mandates that utilities purchase electricity from small-scale generators at (or close to) their avoided costs. Developers could count on relatively predictable PPA rates and terms for their projects, which smoothed the way for scaling development and investment quickly. Many very successful developers got their start in these markets, and many investors could deploy large amounts of capital into portfolios of essentially identical projects, thereby reducing transaction and financing costs. But recently, many utilities in many states -- here’s to you North Carolina, Montana, Utah, and Oregon, among others -- have made efforts to slow activity in the PURPA market. Before you get your hackles up, let’s pause for second to consider how woefully unprepared many utilities were for the onslaught of QF development activity once solar costs dropped low enough to have projects pencil for investors. It is not altogether unreasonable that the PURPA market be reconsidered, as it might not be serving the purpose for which it was originally intended. That said, the disruptive tactics being used by utilities to cool the PURPA market have created a contentious environment. The risk and uncertainty surrounding the future of this market has undermined years of effort and investment on the part of developers and investors. 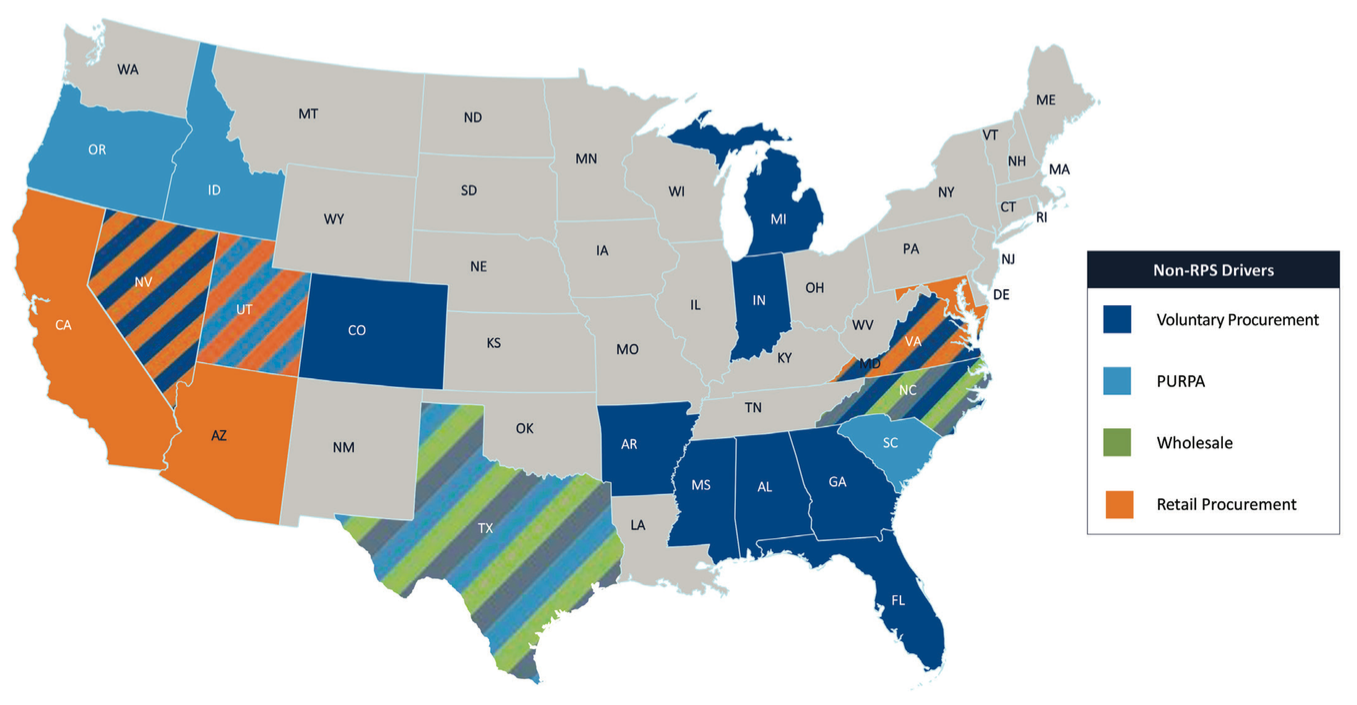 (Source: GreenTech Media) 5. Is solar ready to wean its from the ITC? The time might be sooner than you think. Lest you thought that I was going to skip over perhaps the most important incentive in the solar industry, here are my two cents on the ITC. First of all, weren’t we just here? I recall at the end of 2015 all the consternation over whether the ITC would be extended beyond 2016. We poured over what-if scenarios like the one from BNEF below. We were all in store for a blitz to the ITC finish line at the end of 2016, and, lo and behold, Congress passed an extension just before holidays. That led to some interesting dynamics in 2016, as some solar development that was slated for 2016 ended up being pushed into the future. But, all in all, the solar industry thrived in 2016, and business-as-usual was the expectation through the early 2020s. Given the proliferation of fossil fuel industry proponents and climate skeptics entering the new administration touting the “all of the above” energy strategy as their cornerstone approach, it does call to question whether the ITC is as safe as we thought it was just a short time ago. On the one hand, the solar industry has, with notable success, achieved bipartisan support from the bluest to the reddest states. Solar job creation is an unadulteratedly positive story that few can dispute. On the other hand, there are many Republicans that would love to cut government subsidies of all kinds, regardless of the public good that they might provide. Moreover, there is some momentum behind the idea of a large tax reform, which might lead to a reconsideration of the ITC, among many other tax-related subsidies. Is the solar industry strong enough to survive without the ITC? Clearly, yes. But not everyone, and not all markets. There are many investors who would not lament the elimination of tax equity from the capital stack. But make no mistake, it would be a rude awakening to abruptly end the ITC. I would not put my money on that happening. The cost is modest and there is a sunset clause already in the policy to limit long-term government liabilities. But I cannot, in good faith, make any strong predictions, so be prepared for anything. 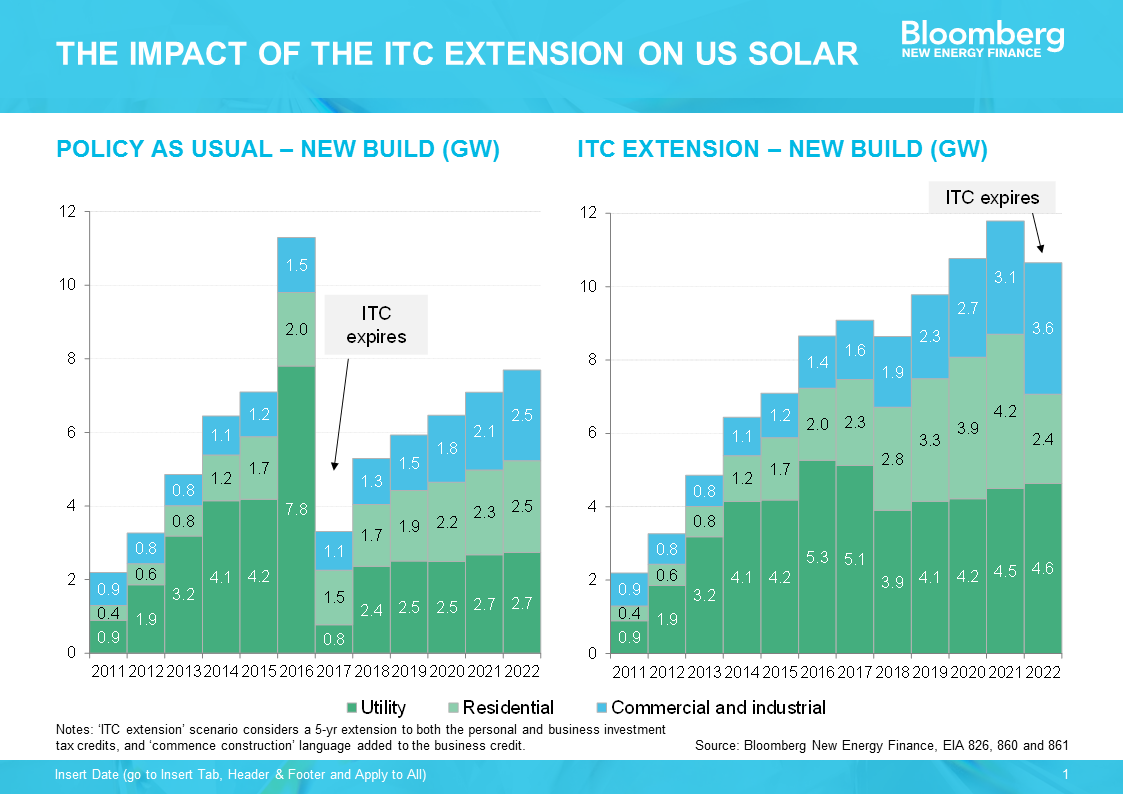 (Source: BNEF)
1. Growth in solar is pushing costs down the virtuous path of technological learning If you consume any media or analysis on the solar market, you have undoubtedly seen many graphs like the one below. That sweet exponential curve has driven much shift in investor attitudes about and activity in solar. It is likely a relief that you are no longer a pariah when you bring up solar at investor conferences. Solar has been one of the fastest growing sources of electricity (along with wind and natural gas) since 2010. 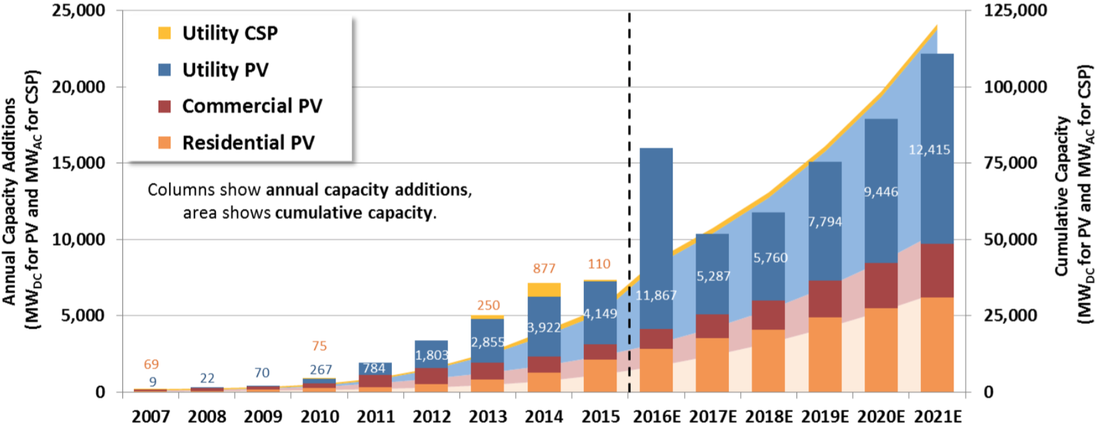 (Source: GTM / SEIA Solar Market Insight Reports, LBNL Database) But the real beauty in the growth of the solar market has to do with technological learning, or the predictable cost decreases that result from increasing “experience” with the technology. Most technologies exhibit the pattern displayed below. Growth in the development (or usage) of a technology unlocks a hidden treasure trove of reductions in cost, which further fuels the positive feedback loop generating more development growth. And so the march goes on. The graph below shows the reduction in the price of solar electricity, which is one measure of cost. We are going to dive into some others. The brain tickler is what the rate of cost reductions will be moving into the future. Even though solar has experienced an unexpectedly rapid reduction in costs, many predict this trend will not abate for some time. 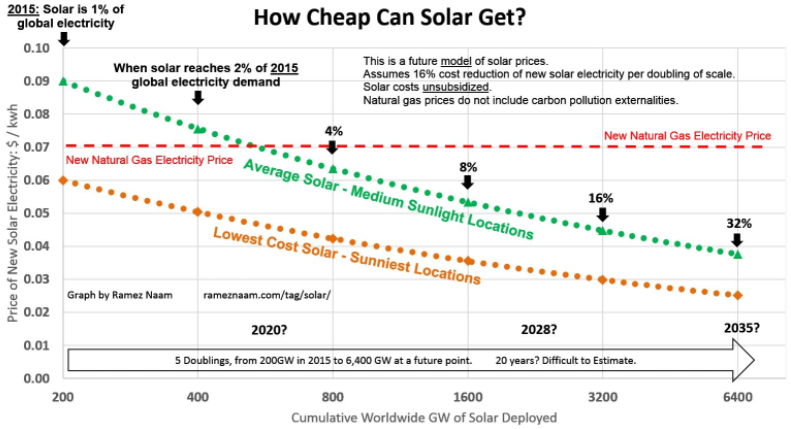 (Source: Ramez Naam) 2. Just because solar build costs are cheapest in utility-scale does not mean that is where the best risk-adjusted returns are The undiscerning investor may jump to conclusions - utility-scale solar must be the best bang for the buck because it is the cheapest. But you would be only partially right (and sometimes mostly wrong). While utility-scale solar is now consistently being installed for less than $2.00/W, this is the market where we are seeing the lowest per kWh revenues, as utilities are getting a bit less generous with their PPA terms (more on that later). But the projects are big and relatively standardized, so the investment profile is still attractive to many investors. Commercial (here referred to as non-residential) solar is a tantalizing market in that it can present an attractive investment profile, but often with some funky (e.g., heterogeneous) risk characteristics. You can find some appealing portfolios of projects above the 500 kW threshold, but there are a whole suite of idiosyncratic risks associated with the offtaker, EPC, etc. Only the brave (and smart) are wading into vast expanse of untapped opportunity in commercial solar, and with some considerable success. Watch out for the leading actors in the space. 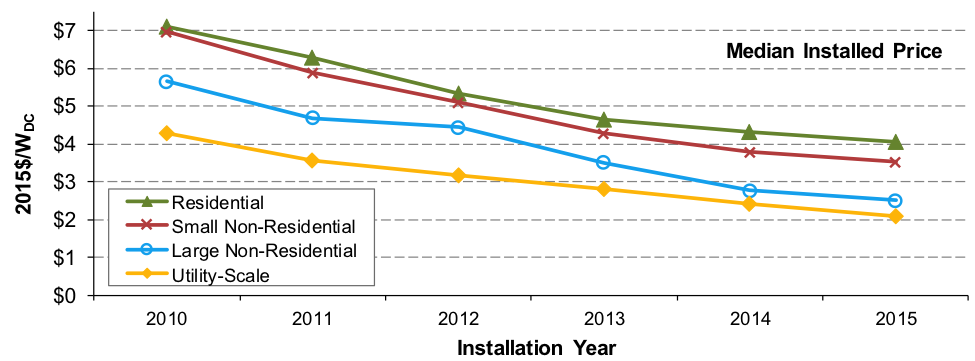 (Source: Scientific American) 3. Averages are useless - smart investors think in terms of distributions It is all too easy to think of solar as a monolithic industry, but that would be missing the story beneath the headlines. Distributions are the key to understanding market trends, and identifying areas ripe with opportunity. The graph below tells a story of market convergence. Most projects are achieving similar build cost performance over time. If you are presented with a project with all-in build costs above $3.00/W, then you either have a particularly challenging project, or a particularly challenged builder. Pick your poison. This convergence also means there is more a general sense of how to benchmark a project, and hold EPCs accountable to the standards being set by their peers. 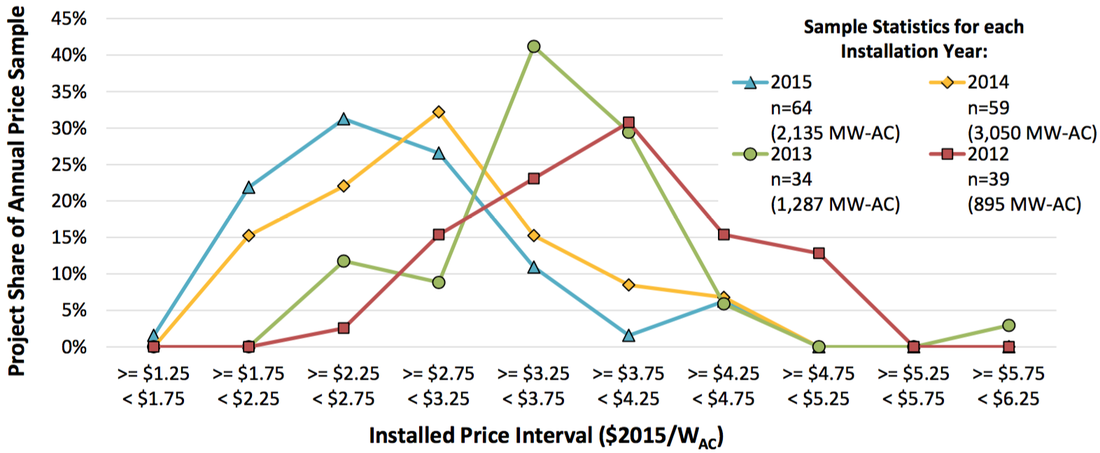 (Source: LBNL) Disclaimer: the sunniest places are not necessarily the best markets for solar. That largely is a policy driven issue, which will be a topic of another post. But sun (or insolation if you want to sound clever) can be very useful. The real takeaway from understanding geographic distributions is that capacity factors (e.g., the underlying technology performance of generating electricity) places some bookends around what sort of revenues and costs a project can support to hit your hurdle rates. The Northeast needs a bunch of incentives to have projects pencil for investors. Less so the case in sunny California or the Southwest. Developers are often inclined to slightly (or aggressively) inflate the performance of their projects. This is an easy area to push back if you have the right data at your fingertips. Remember solar negotiations 101: Don’t take the developer’s project valuation at face value. 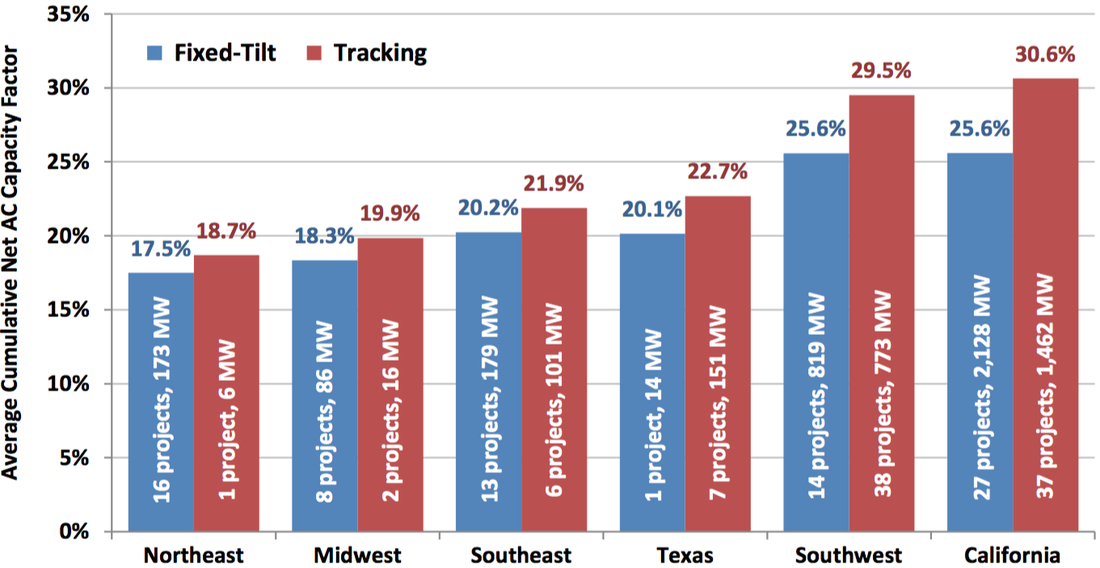 (Source: LBNL) 4. Return compression and the southern PPA migration It is often headline news when a new record low PPA rate is achieved. This is great for offtakers and utilities, but can be a source of deep consternation for investors seeking market rate returns. What is the enterprising investor to do? Utility-scale PPAs are now consistently below the $50-$60/MWh threshold, which is remarkable considering that just a decade ago, PPAs were 5x those rates. But this means that an investor that wants to compete in this market needs deep pockets and a low cost of capital. If when you look in the mirror, that is not you, then it is time for a gut check. Translation - you need to take some perceived (?) market risk. If you want to wade into a different area of the PPA pool, that means tapping to the aforementioned commercial (often referred to as C&I) market, or exploring more nascent markets such as community solar. You may be able to attract better PPAs, but they will be offset by higher per Watt build costs, O&M costs, and a different risk profile. This means a different underwriting and due diligence process that can cascade into high transaction costs for the unprepared. Choose your battles. 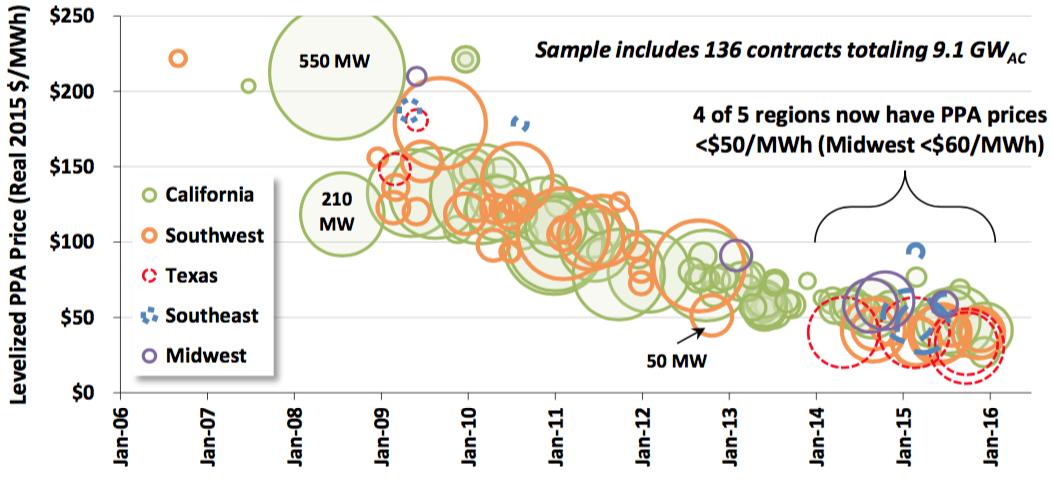 (Source: LBNL) 5. Don’t forget that solar projects are long-term operating assets. Investors should be riding the downward trend in OpEx to boost returns, especially on the back-end. One unmitigated piece of good news for investors is that O&M costs are also trending downward, now below $15/kW-yr. These often underappreciated components of any project cost profile are a key to unlocking longer-term value. Many investors often neglect to put the time and effort needed to manage OpEx costs to optimize returns, especially on the back-end of an asset’s lifespan. If you pay more attention in structuring asset management, O&M, insurance, and other OpEx contracts, the ROI will be, let’s just say, highly justified. O&M Costs 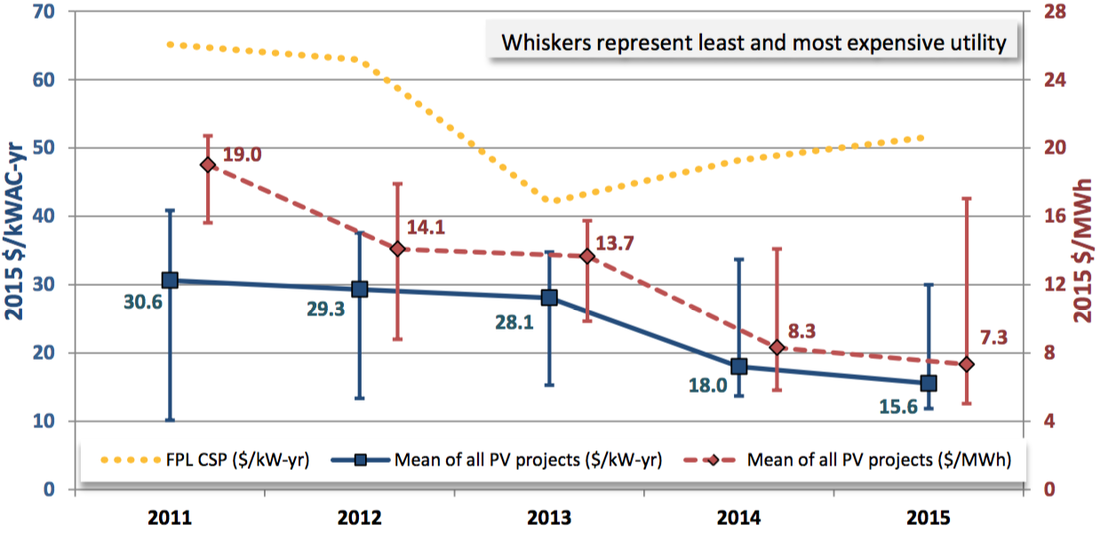 (Source: LBNL)
You may have heard of phrases such as “The Internet of Things” (IoT) or the “Smart Grid.” Both terms are defined differently by many people. According to IBM, the IoT refers to the “digitization of the physical world.” According to the U.S. Department of Energy, the smart grid can be defined as “a [new] class of technology to bring utility electricity delivery systems into the 21st century, using computer-based remote control and automation.” The investment opportunities in improving the intelligence of our electricity generation, transmission, and generation system can be summed up by a joke reserved only for energy geeks (like me). It goes like this: “If Thomas Edison were alive today, and you showed him a smart phone, he would be blown away by the innovation. In contrast, if you showed him how we produce and distribute electricity, he would say, ‘Oh yeah, I recognize that.’” As an example of the scale we are talking about, estimates suggest that the U.S. alone needs to invest US$2.1T by 2035 to upgrade its electrical grid and integrate the massive surge in renewable energy and the need for greater resilience. (International Energy Agency, 2016) As an example of what is coming, consider analyst predictions that the number of internet-connected devices globally will grow from approximately 13 billion in 2015 to almost 39 billion in 2020. (Juniper Research, 2015) Or consider the scale of the opportunity in the infographic below.  Source: Mario Marales, IDC Considerations for infrastructure investors:
The Chief Technology Officer of Tesla, J.B. Straubel, stated recently that it doesn’t make sense for electric vehicles to send electricity back to the grid. In the same remarks, he also noted the following:
What the CTO is criticizing — vehicle-to-grid or V2G -- is essentially distributed energy storage on wheels. The function It takes advantage of unused EV battery storage capacity to allow for power sales back to the grid, either by draining some power when the vehicles are not in use or reducing the vehicle charging rates. At a basic level, V2G has three requirements:
Vehicle-to-Grid Schematic 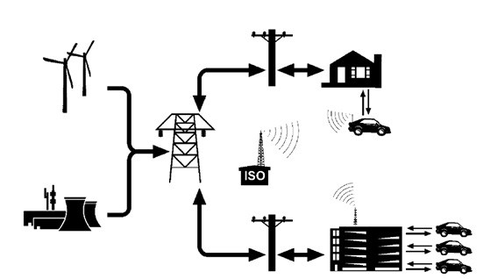 Source: Jim Motavalli, The Azimuth Project The EV technology and services company AC Propulsion, a V2G proponent, outlines the potential benefits of V2G as related to grid services: peak power sales, spinning reserves, base load power, peak power (either as a form of direct load control or to reduce demand charges), and reactive power.
In turn, the EV owners get paid for the energy services provided. But aren’t all of these benefits just the same as those for storage, but in EV form? The figure above seems very similar to one that would be drawn for fixed batteries. The challenges of V2GSeveral hurdles would have to be crossed in the current market and policy environment for V2G to be commercially viable. Among the not-so-attractive characteristics of V2G:
V2G Lite -- Commercial Fleet Applications The first of those challenges above could potentially be met with a market-derived refund incentive, though it is unclear how many EV owners would be willing to own a car with a shorter lifespan in exchange. Alternatively, EV battery manufacturers could design future batteries for more frequent power cycling, but that would require a major and disruptive shift from the current design parameters that do not take V2G into account. The second challenge would seem to be one of public policy, and conceivably overcome if stakeholders from the EV space were united in pushing for V2G (which they’re not). The third challenge might be addressed with commercial EV fleets. In this “V2G Lite” scenario, a fleet owner -- who with the help of data analytics has a good sense of the driving patterns of the fleet -- would be able to sign a power supply contract with a utility that guarantees a certain amount of EV battery capacity at different times during the day. Fleet contracts could be bundled, so risk is spread and utilities only have to deal with a few intermediaries when relying on this stored power source. Even if a fleet was designed to spend most of the day on the road and most of the night charging, there could still be some battery capacity free at certain times, available to be used by (and sold to) the grid. Along these lines, Nissan is notably optimistic about V2G’s horizons, and has been so since last spring when it announced cooperation on V2G efforts with Endesa, a subsidiary of the Italian energy multinational Enel. Now the automaker is working with Enel and the Californian V2G services provider Nuvve to install a commercial V2G hub in Copenhagen, Denmark. The 100 kW project is admittedly small, with 10 Enel 10 kW V2G charging units paired with 10 Nissan EV vans and a Nuvve platform to coordinate when idle vehicles can send energy back to the national grid on demand. V2G Strong -- V2G for Everyone? Or, what might be good for the public isn’t necessarily good for Tesla A group of EV researchers at the University of Delaware is at the leading edge of EV research and those advocating for full V2G penetration. In one study the numbers and justification for a full V2G push are impressive: if we put 20 million light duty V2G EVs on the road (just 10% of the current total U.S. fleet), and conservatively assume a peak power rating of 50 Kw for the cars, we could have a combined power capacity equivalent to the entire U.S. Electric grid. Paired with renewables, the V2G EV fleet would bring game-changing results for CO2 emissions and other transportation sector pollution. The EV future is being built now, with new cars, new charging stations, and new rules and practices. As this new EV built environment grows and develops, integrating V2G capabilities may just add an additional layer of complexity to the overall project, without a certain return. But if we were to make a major push for V2G capabilities to be integrated at the ground level, the benefits for society and the planet could be large. Does every solar project have to be big? Many solar investors’ intuition rests easy when they see the graph below. It fits into the elegant framework of “economies of scale.” The bigger the project, the lower unit cost of installation. The smaller the project, more cost-inefficient. Going big is part and parcel with cost efficiency, or so the saying goes. 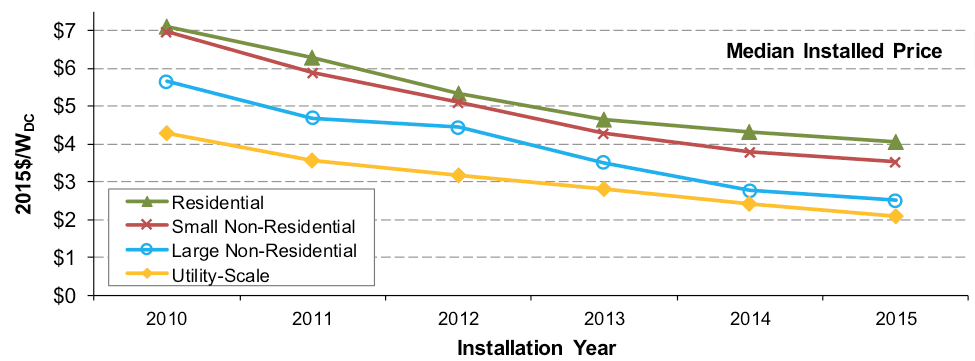 (Source: Lawrence Berkeley National Laboratory) But be careful, this is precisely the rationale used to advocate that utility-scale solar is the only form of solar in which we, as a society, should be investing. Heck, Warren Buffett believes so, and that guy never makes a bad bet (at least publicly). Why produce electricity from projects that can be built at $4/MW on top of a house, when you can generate those same electrons from a larger project that can be built for half the cost? It is a compelling argument, I must admit. But it suffers from the same “big infrastructure” fallacy that is currently hamstringing our legacy centralized energy system. Build BIG projects for cheap on a per MW basis. Big is cheap and efficient. But, as any good economist knows, external costs can cause headaches (and asthma, skin cancer… you get my drift). Utility-scale projects have gotten a free ride See, BIG projects are cheap, in part, because they burden society with costs not borne by the projects themselves. What costs you might say -- only the never-ending litany of transmission and distribution expenditures. Billions of dollars of deferred T&D expenditures hang like a dark cloud over electric sector. And who is paying for those? Not the project owner, that is for sure. Yes, there are interconnection costs, but let’s be real, they hardly cover it. That is not to say that there is not, in fact, a significant need for big projects. But only to a certain extent. Why only build projects that necessitate that we continue to invest so heavily and T&D infrastructure? Small can be beautiful (and efficient), too. Yes, we should invest in more high voltage DC transmission. But, why not minimize the need for such costly investments by building smaller C&I and residential projects? They may be more costly on paper, but at the scale of the whole grid, they may actually be introduce some much needed cost-cutting. Thus, it is the prospect of avoided T&D costs that gives any credence to the claim that smaller-scale projects can be both both prudent and cost-efficient. Avoided costs is a common concept in utility-scale generation, but, for some reason, this logic is not applied to smaller-scale projects. It is not because they don’t make sense, it is because utilities are uncomfortable with power producers that they do not control. Investors start to take notice of smaller-scale solar Now, from the perspective of an investor looking to be a long-term project owner, things get interesting. The graph below show the slow march down the path of PPA price decline. 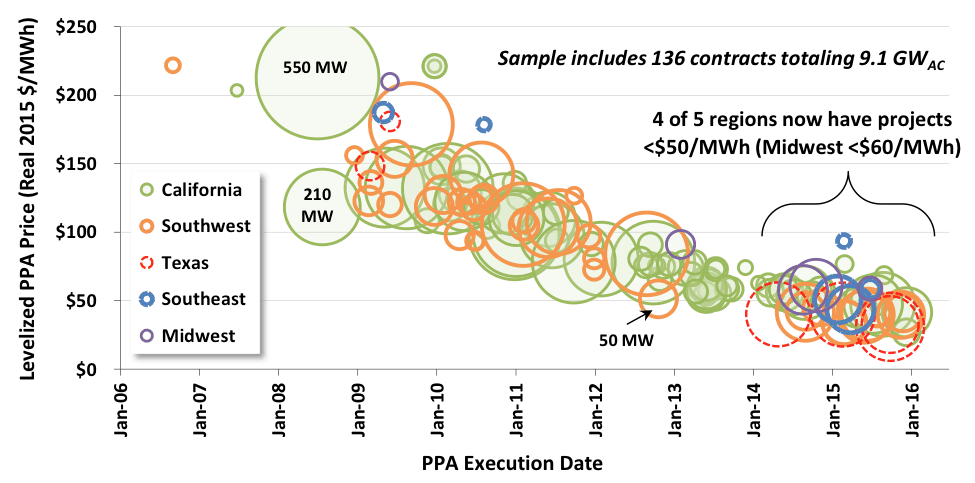 (Source: Lawrence Berkeley National Laboratory)
On the one hand, great - solar power is getting cheaper, and fast! On the other, there is a palpable sense that there is large-scale suppression of investors returns taking place. Fair enough. Once a market matures, actual or perceived technological risk reduces, and returns should decrease. But that does not stop investors from feeling the squeeze. And that squeeze is happening particularly in the utility-scale market. In part because utilities have a lot of negotiating power in many markets, PPA prices are plummeting, some creeping below the $0.04/kWh threshold. There is still value to be had, but the pressure to find good deals has encouraged (ahem… forced) investors to look back into the C&I market for the returns they seek. This is great from the standpoint of increasing access to capital for a market segment which historically has been more difficult to finance. Less standardized and smaller projects, diverse off-takers, many without credit ratings, and less financially robust developers have all hampered the expansion of C&I solar. But, now the suppression of utility-scale solar returns has led investors to start poking around the sleeping giant of C&I solar. Many C&I off-takers have the ability and willingness to pay much higher PPA rates than utilities. Translation = sweet returns. And, there are a LOT of them. If you are lucky enough to find them in places like Nevada where many large-scale C&I customers have been summarily pissed off by the antagonistic treatment by the utilities commission, then you could make some big waves. And, as C&I developers have become more sophisticated, projects are trending towards more consistency, bankability, and less risk. So, keep a lookout as the C&I solar market starts to find that sweet spot in the classic risk vs. return story. Small can be beautiful in the solar market. You’ve seen many headlines touting “record new solar panel efficiency.” We get excited seeing those, too. But they don’t matter. Alright, that was shock value. Let me explain. First, take a gander at the mind-numbing chart from the US National Renewable Energy Lab (NREL) below. This is one of my favorite figures in the whole world. Now, please memorize it -- there will be a quiz later. (Or so I tell my corporate and military executive students. They laugh at my false threats.) What does this figure say to you? 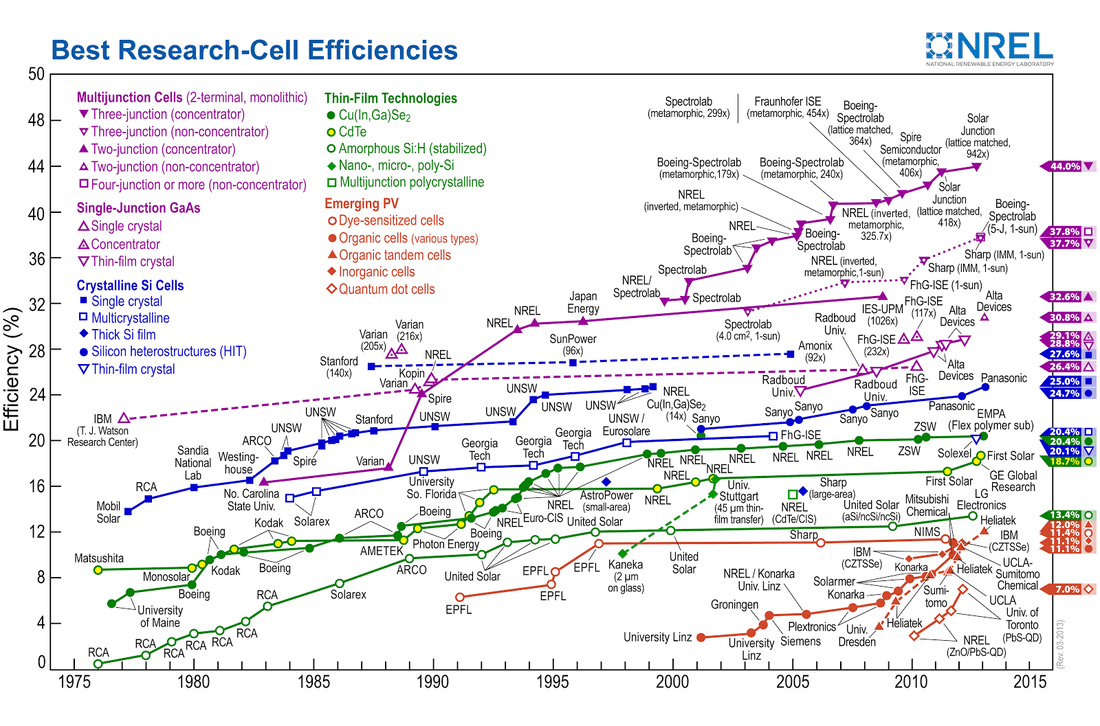 Three potential takeaways: 1. There are way more types of solar panels than you thought, right? 2. Solar panel efficiencies have improved considerably between 1975 and 2015. Duh. 3. The guys doing the stuff in red font should get new jobs given their low efficiency. (Not really. Those are super cheap organic polymer-based solar cells. Their future will come one day.) OK. Now forget that graph. Look at these two more important charts from Bloomberg. 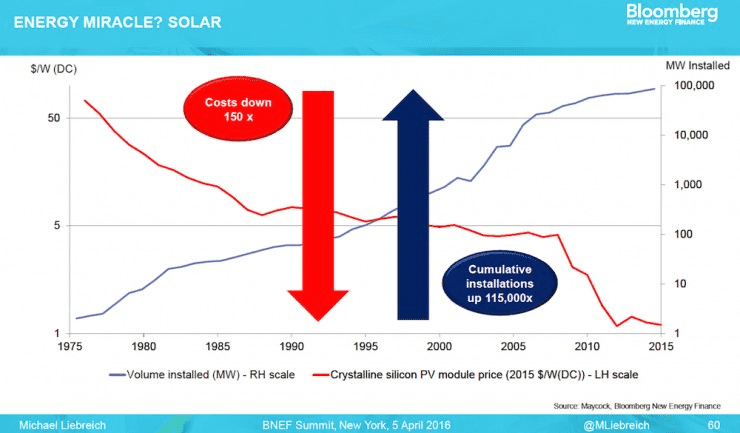 Do you see any relationship between these the red and blue lines? (I hope you do.) Cost falls. Solar installations go up. And now for the next chart. 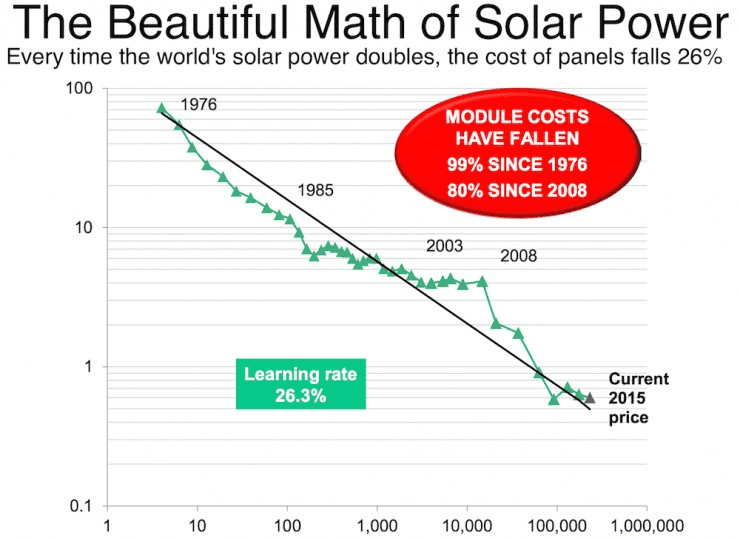 Yes, you are reading that right. A 99% drop in solar panel prices since 1976.
I know, I know. I hear the devil’s advocate: But doesn’t greater volume of solar installations drive down costs? Yep, but the opposite is more true. Cost drives volume. China got in the manufacturing game just as the recession of 2008 hit and EU solar demand fell off. Solar panel prices fell faster and haven’t really stopped, resulting in an 80% drop prices in the last 8 years. For more data and graphs about solar's falling costs and coming world domination (insert dramatic music), see energy rockstar Joe Romm's piece "You’ll Never Believe How Cheap New Solar Power Is." In case you fear that my ponytail is getting in the way of my PhD and love of private equity (insert humor), and that I'm being too kind to solar, consider this projection from Bloomberg: By 2040, global investment in solar will total $3.4 trillion, while fossil fuels and new nuclear will only receive $2.1 trillion and $1.1 trillion, respectively. One word: Yikes. So what? The next time you hear a sales pitch about panel efficiency, praise them for their ingenuity. They are real wizards. But just keep asking: What is the resulting $/kwh and Internal Rate of Return of the solar project? Efficiency is the finger point at the moon. Please go after the moon. 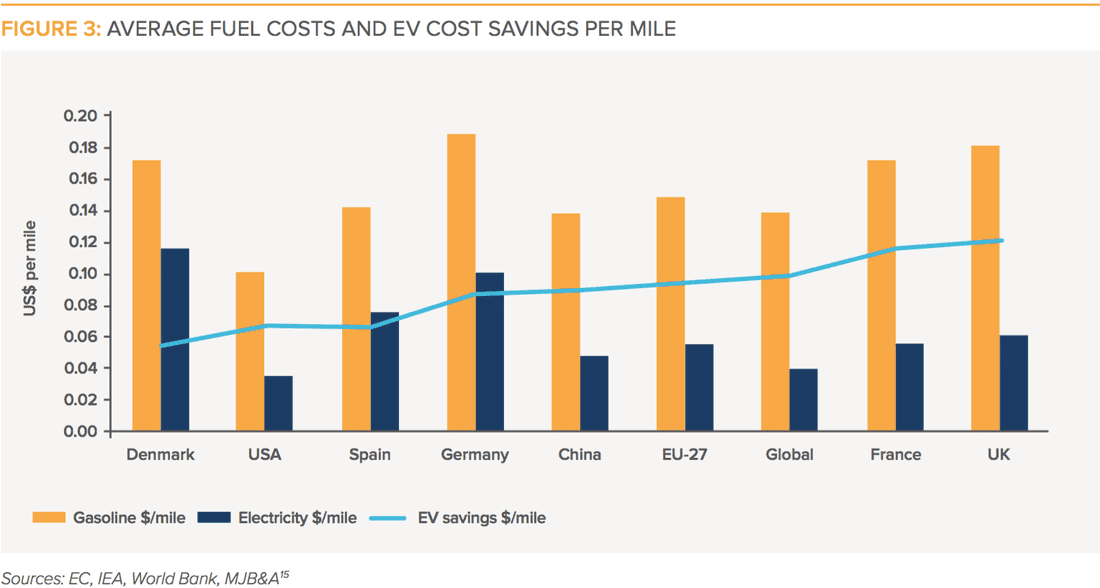 (Source: RMI Electric Vehicles as Distributed Energy Resources) Where are you, rational car buyers? The myth of the rational economic man lurks around the issue of electric vehicles (EVs). See, rationality is something to which many learned folks aspire, but it turns out to be a mirage. Yes, we stumble towards it in a thirsty stupor, dreaming of drinking up its cool, clean sensibility. But, we never get there. It always remains a misty illusion just out of reach. The rationality dilemma with EVs is pretty simple. Let’s make it clear -- EV purchasers are no more rational than EV skeptics. EV purchasers will look at the graph above, and say -- ha! -- I am saving money on a per mile basis compared to all of your fools with internal combustion engine (ICE) cars. They are not wrong, but neither are they entirely right. EV skeptics will look at the graph above and say -- ha! -- you are being duped into assuming this is an apples-to-apples comparison. Again, they are right, but that is not the whole picture, either. Why you are going to lose the “EVs are cheaper over the long haul” debateIt boils down to this. Yes, electricity is a great source of energy, and it is cheaper on a per mile basis than gasoline (even the highly subsidized gasoline that we enjoy, and abuse, in the US). But electricity is electrons, difficult to contain, eager to be used immediately. Gas is a portable, energy dense liquid fuel that affords the owner of this magical worker unsurpassed flexibility in how and when to use it. Ironically, in certain places electricity and gas are made of the same stuff -- oil. I am looking at you, Curacao and Gibraltar, where 100% of electricity is generated from oil! So the real calculation about EVs is more complex because the services that you gain from gas and electricity are not interchangeable. What value do you place on your American right to cruise the highways to your heart’s delight? If the answer is high, then the comparatively lower cost of an EV-mile is meaningless. Your peace of mind in hitting the road without a worry in the world as to how your next mile will be fueled is, in economic terms, infinite. It trumps all other concerns. The term of art for this is “range anxiety.” What value do you place on cheap, clean transportation within a relatively small driving radius? If the answer is high, then the EV vs. ICE cost comparison is how your explain to your beloved significant other why you just purchased a car that cannot comfortably drive the family to visit your in-laws. Oh, and by the way, the sticker price was a little steeper than that conventional car you had agreed to purchase. But really, the EV question is even more complicated than that And that is just the tip of the iceberg. There are many other factors -- your comfort with rapidly improving battery technology, your assumption that EV charger networks will continue to expand, your belief that manufacturers will not bail on EVs in the future, etc. -- that ultimately weigh heavily on any rational calculation justifying or dismissing the idea of purchasing an EV. Dilemmas breed a “let’s wait and see” attitude, how boring Which brings me to the last point. I grant you permission to purchase (or lease) an EV (or PHEV if just want to dip your toes). Don’t feel like you have to explain yourself to your neighbors (though this tactic will not work with your significant other). After all, why did they buy that Honda Odyssey? Was it on a purely rational, benefit-cost maximizing basis? No, they wanted something comfortable and reliable for the family, period. They just wanted it, just like you just want an EV. And let’s be real, you want it because it is cool, wave-of-the-future technology. Because it allows you to avoid ever patronizing another neerdowell, franchised Exxonmobil (or BP, or Shell, or fill-in-the-blank) gas station. Or maybe you just like getting all the best EV charger parking spots. It doesn’t matter - embrace the irrationality. Be an early(ish) adopter. Get onboard, because EVs are where we are headed, like it or not. Queue EV hockey stick graph. 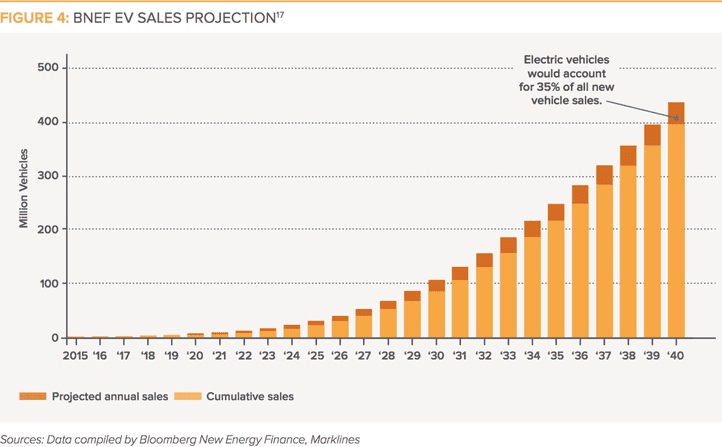 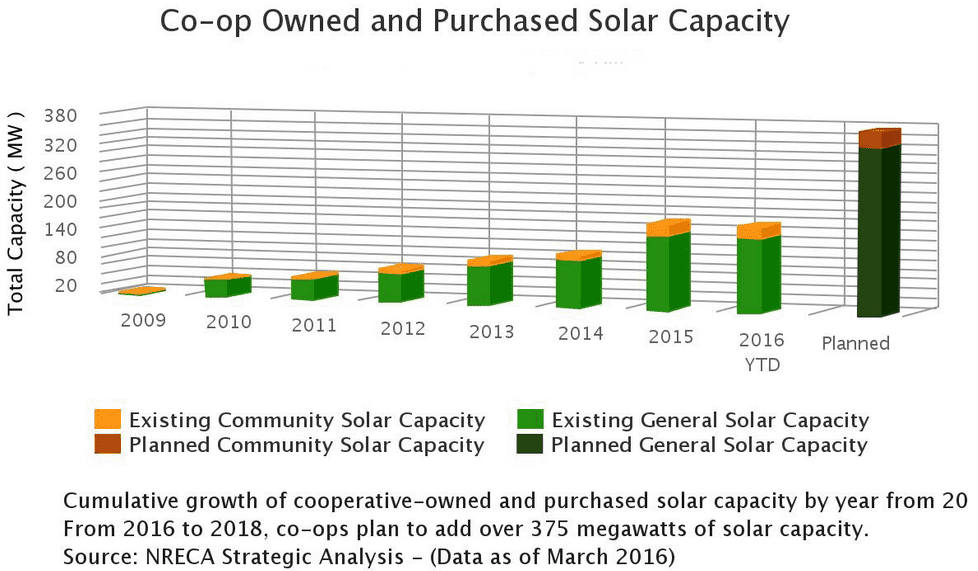 (Source: GreenTech Media)
Co-ops and munis finally get a spot at the clean energy table In the energy industry, utilities have long run the show. The transition to clean energy is undercutting utilities’ historical dominance of how electricity generation, transmission, and distribution occurs. Distribution cooperatives and small municipal utilities have long ridden on the shoulders of these giants, working through contracts that typically stipulate that they must purchase nearly all of their electricity from generation and transmission (G&T) providers. In most contracts, a whopping 5% has been the limit placed on their self-generation, rendering these smaller players [almost] powerless in determining their own energy future. There is some poetic justice in having the small folks granted a spot at the distributed clean energy table. As electric cooperatives and municipal utilities were severely handicapped in their ability to procure their own electricity, they have only dabbled in contracts with independent power producers (IPPs) and other clean energy generators. This came to a head with probably the most unsuspecting sounding cooperative you could think of, the Delta-Montrose Electric Authority (DMEA). As a member-owned, rural electric cooperative based out of southwest Colorado, it is not hard to imagine that the time would come when they would want to be afforded the right to procure their electricity from whoever they please. In an act of magnanimity that perhaps surprised many, the Federal Energy Regulatory Commission (FERC) ruled in favor of DMEA in their case against Tri-State, another cooperative that provides generation and transmission services to 44 distribution co-ops across five states. In short, the ruling lifted the limit on DMEA’s ability to procure electricity from renewable qualified facilities (QFs). The loophole, of sorts, lies in the fact that the Public Utility Regulatory Policies Act of 1978 mandates that utilities must purchase electricity from QF projects. The de facto interpretation of PURPA, for oh the last 38 years, has been that larger-scale utilities and G&T providers would be sole purchaser of electricity from QF projects. DMEA, in a moment of true inspiration, said “to hell with that,” and managed to supersede their contract with Tri-State by asserting that they are themselves a utility, and should be afforded the same rights. This move did not ingratiate DMEA to Tri-State, to say the least, and Tri-State attempted to impose an exit fee on DMEA, which FERC summarily rejected. Message received. Renewables on the grid will no longer be a unilateral decision. Co-ops & Community Solar = Match Made in Heaven It is not hyperbole to claim that this is a game-changer for the nation’s 905 electric co-ops and 835 municipal utilities who woke up following this FERC ruling to a new world of opportunity. How fitting. Co-ops and munis were probably on the leading edge of support for renewables, and now they have license to act on their values, rather than be subjected to energy procurement decisions out of their influence. And that is a very good thing. In fact, it is 987 TWh/yr of a good thing, which if you do the math, implies that the potential market for co-op/muni renewables approaches 400 GW. Many co-ops and other smaller utilities are structured in ways that are much more conducive to serving the public good. Often they are publicly or member-owned, or at the very least not publicly traded, which makes them more intimately connected to their customers and ratepayers than the larger utilities and G&T providers that dominate much of the electric power procurement space. Moreover, they are more likely the engage in novel project types like community solar. There is some cosmic symmetry in enabling co-ops/munis to sponsor community solar projects. It makes so much sense. It seems ludicrous that this was ever challenging to execute at a meaningful scale for many co-ops. According to RMI, the market for community-scale solar projects ranging between 500 kW and 5 MW of capacity each could exceed 10 GW by 2020. Wake-up Call for the Generation and Transmission Providers An ancillary benefit of this new arrangement is that community solar projects may now be easily integrated into the local distribution system, therein avoiding many costly infrastructure upgrades. Translation: electric distribution co-ops/munis may be able to purchase power directly from QF projects at a lower cost than what they are currently charged by their G&T providers. Memo to G&T providers. This also means that they will be reducing their reliance on your services and undercutting your revenues, unless you can evolve together into helping to co-create a clean energy future. Now, there are limits to be sure. Electric distribution co-ops/munis have only been afforded the right to negotiate PPAs (and not just based on avoided costs, as in the past) with QF projects in their territory. Not a bad deal, but it does not make them an autonomous entity. Co-ops/munis still have to balance their energy supply, which can only be done through grid management in the transmission and generation system. So, there may be some building tension in the marriage between electric distribution co-ops and their larger G&T brethren. No one wants to see the G&T providers go extinct. In fact, they are still a critical species in the electric grid ecosystem. But, the challenge will be in better collaborating and coordinating with their member co-op/muni friends. This is not a reach. And there is no better time than now. Look for inspiration? Well, look no further than RMI’s Shine Initiative, an innovative program aimed at helping accelerate solar procurement in the community-scale market. Which ducks do you see?The California Independent System Operator (CAISO) can be commended for providing an accessible daily data dump on renewable usage across its system. With these data one can construct various “duck curves” for the grid’s daily net load profile, the shapes of which result from the rising penetration of a variable energy resources (VER) such as wind or solar. VERs exhibit four characteristics:
Duck curves are in essence the daily net load profiles after accounting for VER generation. They show the required remaining dispatchable energy required to ramp up or down to take up the solar and wind shortfall. As we see from the two examples below, duck curves can take on various forms, often depending on the scale range of the y-axis. 1st flock of ducks: Average net load profiles over seven days around March 31, over 2013-16. 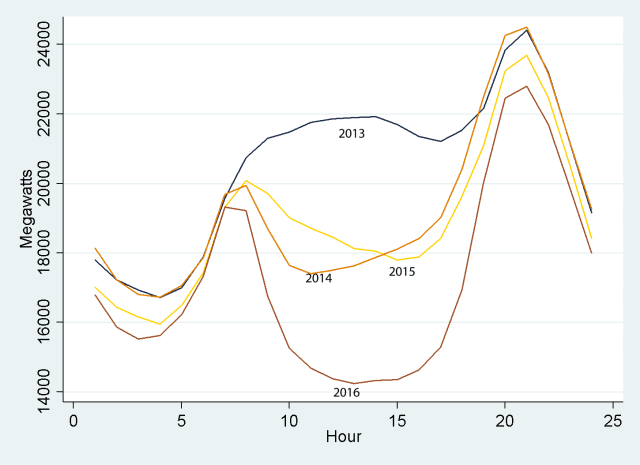 Source: Blog post by Meredith Fowlie, “The Duck Has Landed” (5/2/16), using CAISO data. 2nd flock of ducks: Net load profiles for March 31 for 2012 and 2016. Forecasts for 2017 and 2020 were made in 2013. 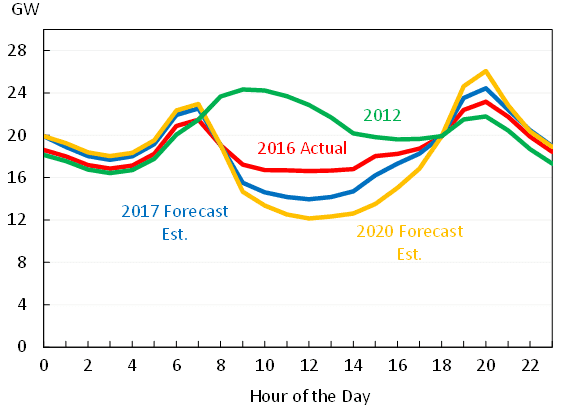 Source: Council of Economic Advisors, The White House, “Incorporating Renewables into the Electric Grid: Expanding Opportunities for Smart Markets and Energy Storage,” Fig., 4 (June, 2016), using CAISO data.
Both sets of curves cover almost exactly the same sets of data, with the first emphasizing a more extreme story. The the stories are essentially the same -- net load after VERs bottoms during the day when solar is peaking, ramps up very quickly as solar generation drops off dramatically and evening usage rises, and then drops again as nighttime usage drops and wind picks up. The takeaways are two:
Ancillary services as regulation mileage A recent report from the Council of Economic Advisors at the White House goes deeper, looking at some ways of understanding the value of energy storage via the idea of regulation mileage. The concept measures the changes -- increases or decreases -- in power output that a grid operator requests from an electricity generation resource over a specific timeframe. It would stand to reason that regulation mileage, a proxy for the amount of ancillary services required, would be determined by several factors. The Council’s study looks at the total load, the amount of that load from VERs, the slopes of each of those load curves, and a series of effects that are specific to the hour of the day, day of the week, and week of the year that the electricity is generated. Among other results, and as expected, one of the clearest that appears is that the slopes of the load and VER generation have a lot to do with the services required. In other words, the faster the late-afternoon ramp up at the end of a sunny day, the more energy storage will be wanted. Valuing storage based on its ancillary benefits What are other approaches to valuing energy storage in these settings? The peer-reviewed journal Nature Energy recently carried the results of a new study on capturing the full benefits of energy storage in investments. Applying a techno-economic model, the authors of ”Limiting the public cost of stationary battery deployment by combining applications,” find that battery storage becomes more attractive as an investment as each storage facility offers more energy services. An article summary carries the message that energy storage apart from pumped hydro is, “still considered unattractive by investors on mainly two grounds: cost-competitiveness with other technologies and the absence of a commonly shared classification of electrical storage as a competitive or regulated activity -- that is, as an electricity generation asset or network component” (emphasis added). The drawn conclusions are that the best way to incorporate all of these benefits are to remove non-market barriers, a legacy of rules that were originally written for conventional generators. According to the summary, these “institutional and regulatory frameworks are key elements in the determination of the economic value of storage,” and “economic principles require new, enabling rules to be technology neutral, that is, not directed at the diffusion of storage or any other technology in particular.” The article calls for three such policy recommendations:
This policy neutrality from above is a point worth repeating. In revising public policies, the goal is not the promotion of energy storage out of any favoritism towards the technology. Rather, the point is to promote energy storage as an enabler for VERs such as solar and wind, which in turn leads to progress on an overall societal goal of reducing greenhouse gas emissions. 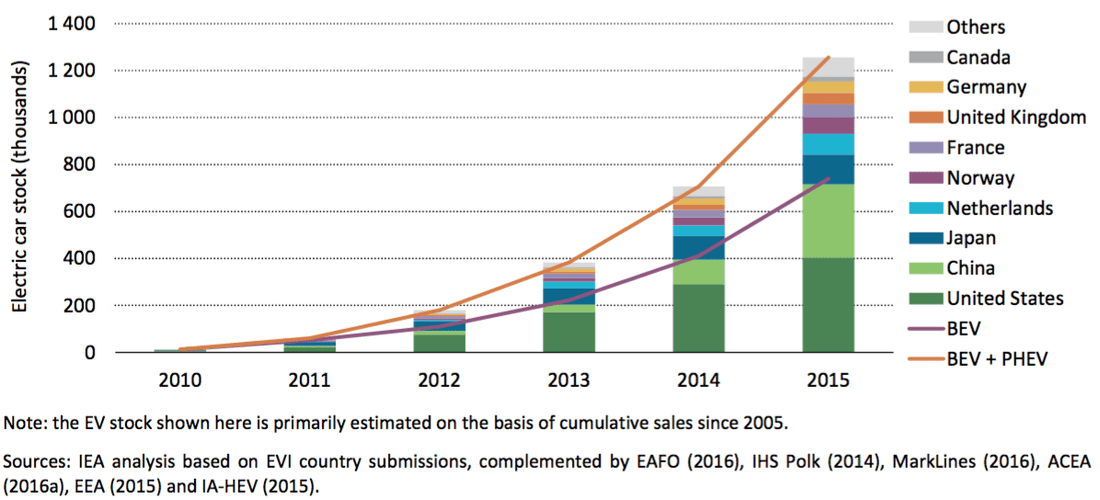 (Source: IEA) The International Energy Agency must love the Stanley Cup Playoffs because their recently published Global EV Outlook was full of hockey sticks! The hockey stick graph, you may recall, was popularized as a key piece of evidence supporting the existence of climate change. Rest assured, there will be no debate of climate change here. I am a deep believer in the appropriate use of sports metaphors to describe complex phenomena. The greenhouse gas emissions hockey stick graph tells about as simple a story as can be told about climate change. The hockey stick is a pithy way of showing how a creeping linear trend jumps into an exponential growth (or decay) phase. Our minds are wary of things that change exponentially. They are just not normal. That is because from one time period to the next, your worldview, let’s call it your umwelt, is dramatically different. Yet, as history shows, this Law of Accelerating Returns holds to key to understanding technological progress over the course of history. We see hockey sticks everywhere now. Some, we should get excited about like renewable energy deployment. Others, we might be wary of like the growth of the economy. Some indicate a phase shift, as in the case of the transition to renewable energy. Others might indicate a boom-and-bust cycle, with exponential growth followed by precipitous declines. The trick is understanding the underlying drivers of change. So, about EVs. Not long ago, EVs were very rare, too expensive, and only the most ostentatious environmentalist among your friends was even considering buying one. Skip ahead five years, and all of sudden, your umwelt has changed. The Law of Accelerating Returns has been hard at work. Now, you are starting to see EVs everywhere you look, EV charging stations are taking up the best parking spots, and your neighbor down the street likes to park their EV in the driveway to show it off while it charges. And this is just the beginning. 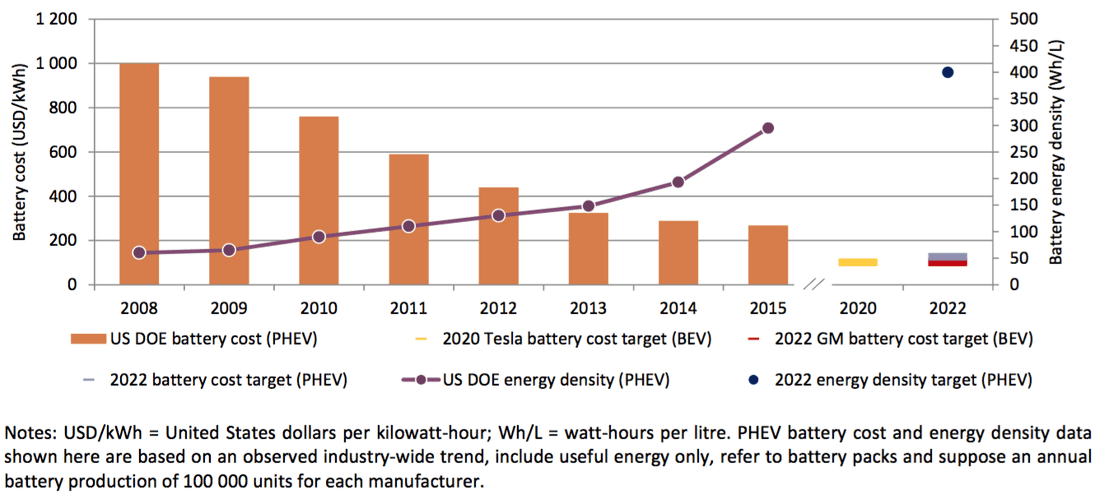 (Source: IEA)
What changed? Well, largely it was a story of rapid technological innovation leading to dramatic cost reductions. The most important of these is with the battery, of course. As batteries make up around ⅓ of the cost of an EV, the increases in energy density coupled with the reduction in battery cost have started to bring EV costs down from the stratosphere. And not to dismiss, also helped alleviate the all-important “range anxiety.” We Americans do have a pastime of hitting the open (or congested) road without a worry until the next gas station. If battery technology continues its march of progress, look out for the Law of Accelerating Returns to come into full force in the EV sector. Annual U.S. Energy Storage Deployments, 2012-2020E 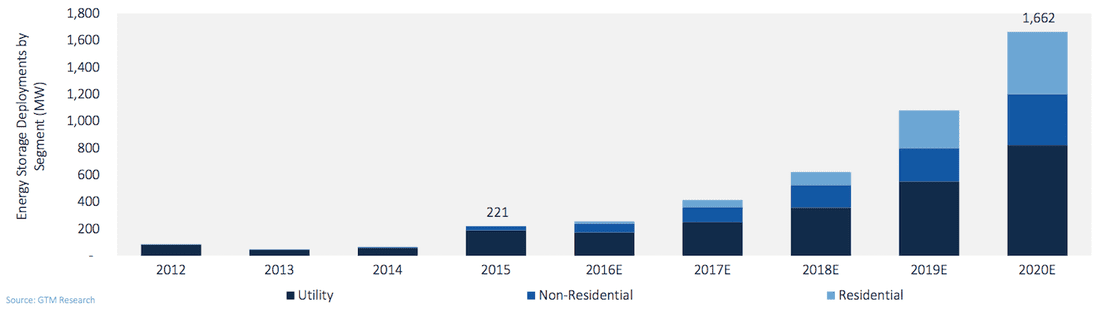 Can somebody throw the energy storage industry a bone? It is a little known fact that the investment tax credit (ITC) was a key catalyst for the emergence of solar as an essential component of the future electric grid. Well, not really. That statement borders on platitudinous. It should be no surprise, then, that the energy storage industry is angling for similar treatment by the almighty tax deities at the IRS. Energy storage, after all, is touted as being a key enabler of high levels of renewable energy penetration. Handcuffing energy storage will only undermine the grid integration of solar and wind down the line. So, can the energy storage industry get a bone here? Yes, it is a relatively nascent industry (at least in battery technology) undergoing a rapid period of technological learning and experimentation. But out of the frey, we are starting to see some dominant technologies and applications emerge within functional markets. While lithium ion batteries are the current industry darling, there are many other viable storage technologies including stored hydropower, which still dominates the energy storage field overall. In the periphery, there are a host of other storage technologies incubating in R&D facilities, start-up companies, and corporate technology giants. Perhaps in response to the eventuality of energy storage becoming a key component of the electric grid, the IRS threw the energy storage industry a bone, but it came with some strings attached. Energy storage already qualifies for the ITC, right? Yes and no. Yes, energy storage already qualifies for the ITC, but no, it is does not qualify under all circumstances. Energy storage that is powered by solar or wind qualifies for the ITC, though with some caveats related to the extent to which grid electricity is also used to charge the energy storage system. This is where things get a little tricky. Assume that you have an off-the-grid solar + storage facility (a grid defector!). Simple - the ITC applies, and you can get on with your homesteading. But for all grid-connected systems, there is an upper limit to how much charging your storage system can receive from the grid and still qualify for the ITC. That magic number happens to be 25%, meaning that a whopping 75% of energy storage charging needs to come from solar. That is just the minimum standard for qualifying for the ITC. The full ITC benefit is reduced in proportion to the amount of energy input coming from the grid, so anything less than an energy storage system charged by 100% solar will receive less than the full ITC benefit. Add to string the fact that solar + storage projects are benchmarked to the first year’s solar power output for the subsequent four years of the tax benefit, which means that any reduction in solar output will be penalized with a lower ITC benefit. And all of this was articulated in a private letter, which does technically establish a precedent, but is a somewhat opaque way to communicate what could be a substantial benefit to the energy storage industry. See here for a clever dive into the details of solar + storage. Stand-alone energy storage ready for an ITC vaccination It is clear that coupling solar (or wind) with energy storage is a good idea, and will be done with increasing frequency over time. It is also clear that energy storage will not and should not be relegated to the sidelines of the ITC prom waiting for some attention from the solar and wind dancers on the floor. In fact, it is imperative that energy storage be granted a clear and clean invitation to the ITC prom independent of their relationship to solar and wind, when and where appropriate. If the aim is to reduce barriers to more energy storage development providing flexibility and ancillary services to the grid, then there is a pretty obvious argument to be made about the need for a little ITC vaccine for stand-alone energy storage. Why a vaccination? Well, energy storage, like many emerging clean energy and smart grid technologies, could benefit from an inoculation against investor skepticism. There is no shortage of bullish projections about the future of energy storage, yet many project developers find themselves searching for capital. Even when they land upon a willing investor, their investment often comes with a heavy cost of capital penalty due to the perceived risks and uncertainties associated with energy storage projects. Not unjustified on the part of the savvy investor in search of those ever elusive risk-adjusted returns. But also not the formula for ramping up energy storage deployment, which, after all, is the key to sussing out technologies, business models, and financing structures. Learning, in other words, which is exactly what the ITC has been doing solar all of these years. Roping in stand-alone energy storage projects into the ITC framework could be just what can get investors over the hump of really going gangbusters on energy storage. 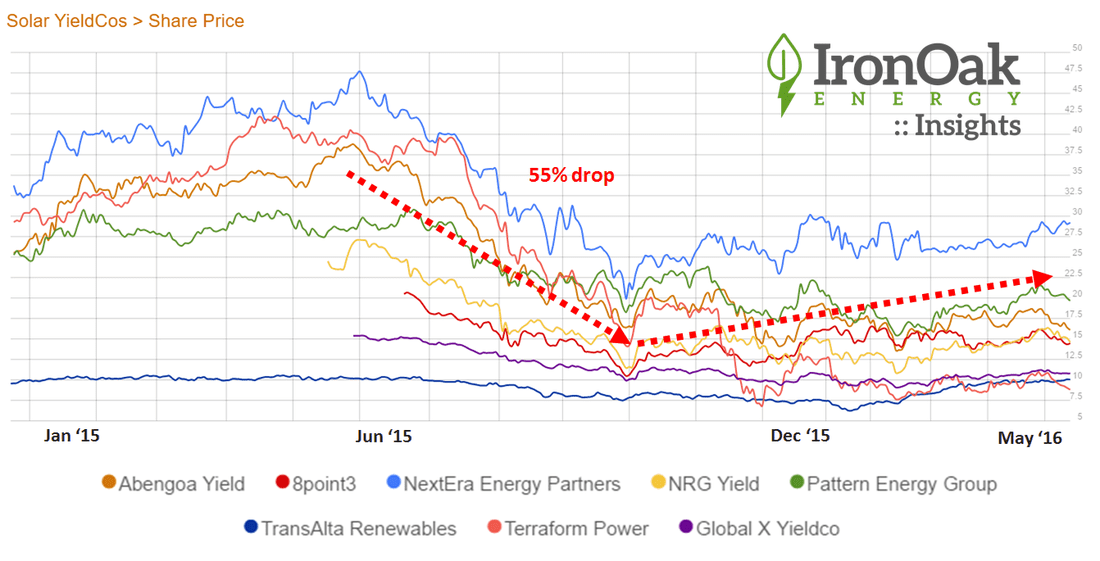 Last year, IronOak Energy’s investment advisory practice had some challenges competing against yieldcos on behalf of our solar investor partners.
We kept abreast of the yieldco’s up/down trends at IronOak’s stock chart. They were offering what some called “a stupid low” cost of capital. That was sometimes said as a judgment on the the yieldco business model. Other times it was a said with a slight jealousy: “I wish our yields were still attractive at those levels so we could win more deals with predictable long-term cash flows.” Developers licked their lips. Those low-yield requirements made their discounted cash flow models really sing. As we all know, in late summer last year, both developers and yieldcos bought their share of Kleenex boxes. But this was great news for private equity and helped improve their returns. Many claimed the model was broken. We thought that was shortsighted. Sometimes innovators hit a speedbump, but then they hit the accelerator again. Now several yieldcos are getting ready to go to public markets. It’s not time for them to be big-time project buyers at attractive costs, but that time will come. For now, private equity still rules. In a previous blog, we reviewed how pumped hydro storage still dominates all storage technologies in the United States, with the existing capacity of 20,356 MW expected to grow by 20% with an additional 4,150 MW. Thermal storage is projected to add 302 MW of rated power to an existing 553 MW (an increase of 54%), electro-chemical approaches will add 602 MW to the existing 405 MW (+148%), and electro-mechanical technologies will add 706 MW to the existing 169 MW (+418%). How does the global picture look? We refer again to results obtained from U.S. DOE’s Energy Storage Database. The figures below show the somewhat dramatic transition between the “old” (existing operating capacity) and the “new” (projects that have been announced, contracted, or are under construction) in energy storage projects around the world. Old school made new: A pumped hydro renaissance? Pumped hydropower looks at the new-fangled batteries and other technologies coming out with regularity, and feels like a person out of place at a hipster bar. But this technology, which has been around since it was first used in Italy and Switzerland in the 1890s (soon after the world’s first hydroelectric dam began operations in Wisconsin in 1882), remains the overwhelming leader in the energy storage arena, both in existing and future capacity. Indeed, with newer variable speed pumps that are better able to coordinate with electric grid needs, a pumped hydro storage renaissance may be under way. 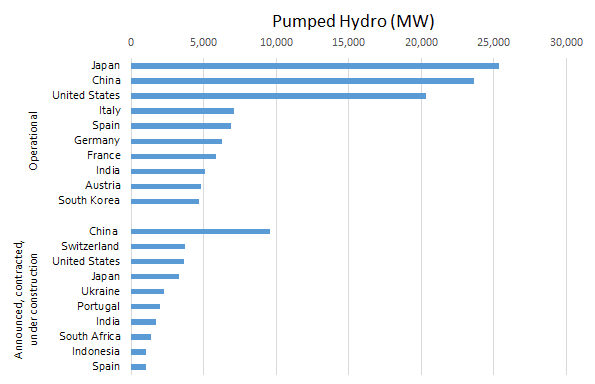 (Source: DOE Energy Storage Database, data downloaded 4/29/16) From the figure above, Japan, China, and the United States are the clear top three in this area, and each are making significant new builds along Switzerland. The scale of pumped hydro is impressive, as new projects in less developed countries such as Ukraine and India represent a higher capacity addition than those from all other technology types and all other countries. All in on the newer energy storage technologiesThe electro-chemical category includes all of types of batteries (e.g., flow, lead acid, lithium ion, metal air, sodium-based, and zinc air) as well as electro-chemical capacitors. From the chart, the United States is the clear leader in this technology type, and its capacity is expected to more than double. Other nations that have already bought into battery storage are projected to buy in even more, such as Japan, China, and Chile, with relative newcomers like Italy, The Philippines, and Kazakhstan jumping in strongly for the first time. 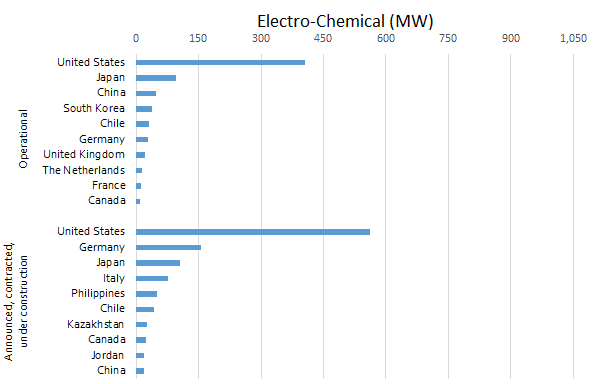 (Source: DOE Energy Storage Database, data downloaded 4/29/16) Current electro-mechanical storage applications, which include compressed air storage, flywheels, and gravitational systems such as railcars, have been tried at scale only in Germany, the United Kingdom, and the United States. And while these three top the areas with new capacity coming on, a larger set of new countries are testing the waters, though admittedly at a very small scale. 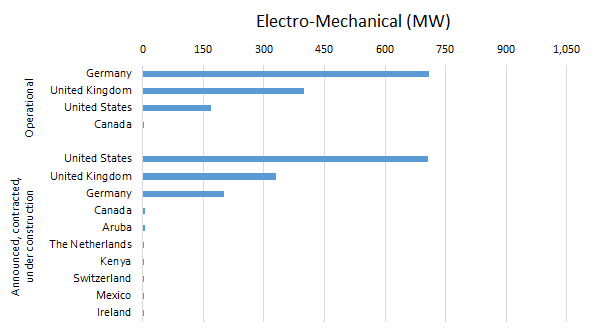 (Source: DOE Energy Storage Database, data downloaded 4/29/16) Thermal storage (e.g., ice, molten salt, and other approaches) has also been dominated by three countries—here, Spain, the United States, and South Africa. Here too the technology is diffusing across a much wider array of countries, with most outside of the original top three starting basically from scratch. 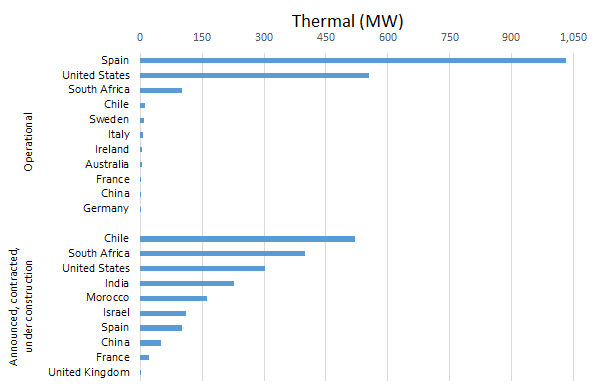 (Source: DOE Energy Storage Database, data downloaded 4/29/16) Finally, by way of comparison to the other energy storage approaches, global hydrogen storage is miniscule, as the total of listed projects includes 2.7 MW in Germany and 0.2 MW in France. The method is straightforward—excess electricity is sent through a Proton Exchange Membrane (PEM) to electrolyse water into hydrogen and oxygen. The hydrogen can be stored on-site (as with a “wind to hydrogen” concept for wind turbines) and then later either sold and fed either into pipelines for grid electricity production or used directly for on-site electricity generation in a fuel cell. (It can also be sold for use in fuel cell vehicles, or as an input in ammonia production). Although the base is low, this method of storing energy is expected to more than double in global size, with Canada, Italy, and Germany developing an additional 2, 1.2, and 0.8 MW, respectively. Many future energy storage leaders are starting from scratchIn the final two graphs below, we see the total rated power of energy storage by the leading countries, including both existing capacity (in blue) and capacity expected to come on line soon (orange). As noted before, pumped hydro skews the results. At left, which includes pumped hydro, China, Japan, and the United States will remain the dominant players in energy storage overall, with significant capacity additions expected for these countries as well as Switzerland, which will more than double its storage capacity. Other nations in Europe—like Spain, Italy, Germany, France, and Austria—will be relatively stable when it comes to total energy storage.
(Source: DOE Energy Storage Database, data downloaded 4/29/16)
At right, taking out the pumped hydro data, notice first that the y-axis scale has dropped by an order of magnitude! In this non-hydro arena, the United States is the clear global leader. Also notable is that many countries are almost starting from scratch to build energy storage capacity in these non-hydro technologies, including Chile, South Africa, India, Morocco, and Israel, while Germany, the United Kingdom, and Japan will be making significant additions. The lessons? If you’re in the battery or other non-pumped hydro storage areas, be aware that efficiencies are improving in pumped hydro that may be worth paying attention to, at least at the international level. And of course if you’re in the pumped hydro field, you have some new competitors as well. Further reading: In our previous monthly reports we have focused on state solar policies. Our research indicated a growing trend among state legislators and regulators to review, amend, and in several cases, phase out or even cancel solar incentives and long-standing, proven solar policies. Although this process could be viewed as a natural regulatory action in response to a market reaching maturity, it has nonetheless taken its toll on the solar market. After the Nevada Public Utility Commission’s controversial December 2015 decision to slash net energy metering, many residential solar installation companies halted operations in Nevada, with giants like SolarCity and Sunrun exiting the state. Similarly, Michigan’s legislature is considering a change to its solar policy that will reimburse generators at wholesale rather than retail rate, making the state’s thriving solar industry nervous. In February, Massachusetts reached its net metering and REC caps, halting operations of solar developers and installers in a state that has more solar jobs than any other state except California. And North Carolina’s lucrative solar tax credit is set to expire at the end of this year, creating uncertainty and concern among local industry players in one of the nation's largest solar markets. Policy uncertainty is never a good thing. However, what many state-level regulators and legislators tend to forget is that keeping policies unchanged is not enough; to continue to grow, the solar industry needs certainty as much as it needs stability. In a constantly changing regulatory environment, threats are almost as much of a problem as actual changes. Initiatives to review or amend policies, increase rates, or decrease incentives make investors wary of new investments, thereby escalating the cost of raising capital. Thus, while DC legislators have contributed their share to the national effort to create certainty and stability in the solar market, state legislators are failing to do their part. This is rather sad news for the solar industry that celebrated the ITC extension, but relies on states’ policies to continue driving investments in solar energy. Indeed, renewable portfolio standards account for more than 50% of investments in utility solar, and net energy metering is considered the main driving force behind residential rooftop solar. However, it is not all grim for the solar industry. Despite the uncertainties from state to state, the industry continues to grow. The quarterly SEIA/GTM Research U.S. Solar Market Insight report for Q4 2015, released in early March, predicts that the solar market will grow 119% in 2016. As in previous years, most of the projected added capacity is attributed to utility scale installations. But if many states are not providing the stable regulatory framework required for a healthy business environment, where is this substantial projected growth in utility scale solar coming from? Before Congress extended the ITC, the 30% tax benefit for solar installations was set to drop to 10% on January 1, 2017, and to expire in 2018. This tax cliff created an incentive to bring as many projects as possible online before the 2017 drop down, thus driving the unprecedented expected growth in 2016. Utility scale installations require long planning and development, so although the ITC was extended last year, it was too late for players to react to the new tax environment. This is why installations in 2017 are expected to fall significantly, while commercial and residential PV will be less affected. The effect of the ITC extension on the different solar sectors can be seen in the graph below. U.S. PV Installations With and Without ITC Extension, 2010-2020 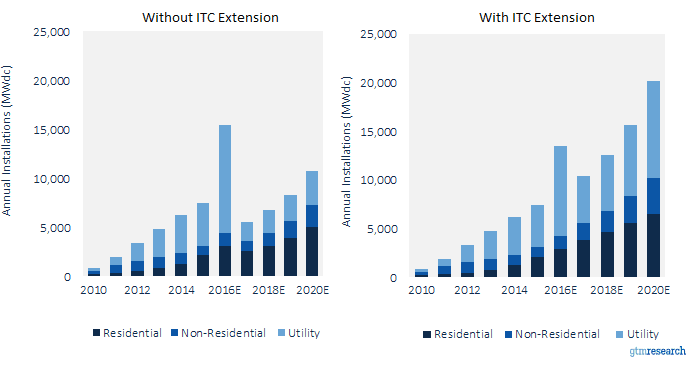 (Source: GTM Research) Moreover, there is another federal framework that drives investments in utility scale solar. Unbeknownst to many, the federal Public Utility Regulatory Policies Act of 1978 (PURPA) is gradually emerging as a useful tool for utility scale developers in a post-RPS world. Enacted in response to the 1973 energy crisis, PURPA imposes a mandatory obligation on utilities to purchase renewable energy from “Qualified Facilities” (QF) at the utility’s avoided cost. To meet the requirements for a QF, an energy-generating facility must not exceed 80 MW and its primary energy source must be biomass, waste, geothermal, or renewable resources. With prices per megawatt-hour in the $40 to $60 range, utility solar is at cost parity with natural gas, making it a strong competitor in PURPA’s avoided cost markets. In 2015 over 500 MW of PURPA-driven projects came online in North Carolina, and states like Texas, South Carolina, Utah, Oregon, and Idaho are also leading the way in utilizing PURPA for utility scale solar. States With >50 MWdc Non-RPS Utility PV in Development 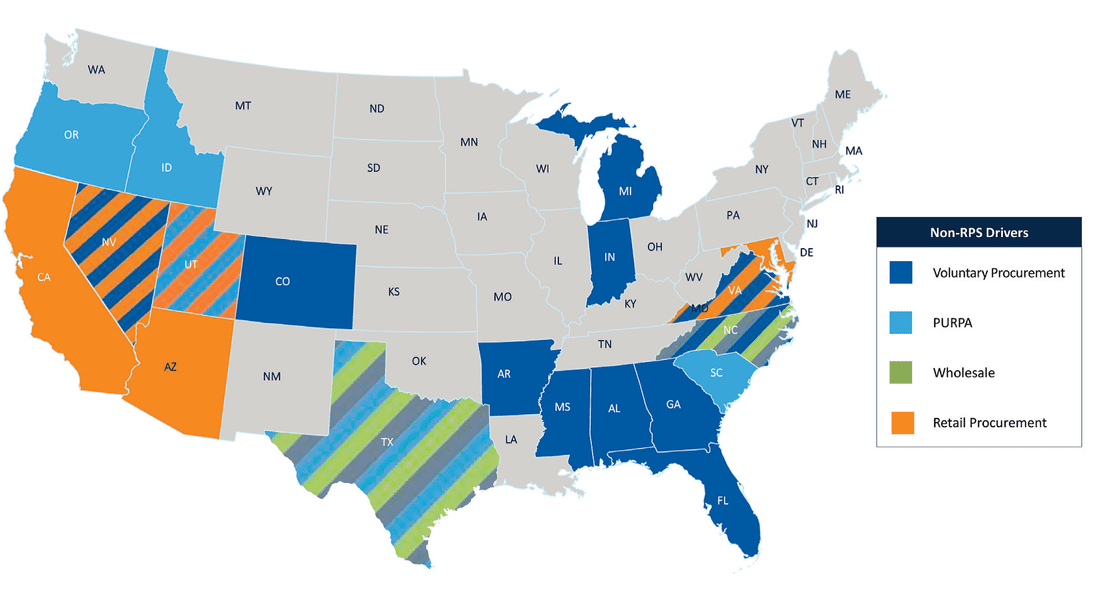 (Source: GTM Research)
As a federally mandated purchase, PURPA solar projects are not subject to state solar caps. Moreover, FERC regulations define “avoided cost” as the incremental costs to an electric utility of electric energy, capacity, and environmental externalities fees which the utility will incur if not purchasing electricity from the QF. The broad definition of “avoided cost” allows more facilities to enjoy QF status. However, despite the seemingly positive outlook for PURPA’s potential for solar developers, one must remember that it is very hard to enforce a PPA on a utility that does not want to enter one. One way of deterring QF developers from engaging with uninterested utilities is to propose terms and conditions that are more onerous to the QF than to non-PURPA counterparties. While FERC has succeeded at curtailing such practices, bad faith negotiation tactics are hard to prove and only few developers are willing to pursue costly litigation in an effort to obtain a PPA with an obstinate utility. To reduce transaction costs and assist smaller developers in negotiating with utilities, certain states have adopted standard contract rates for QFs of up to 10 MW (California up to 20). The standard contract makes it nearly impossible for utilities to avoid purchasing electricity from QFs. It is therefore not surprising that utilities in leading solar PURPA states are requesting utility commissions to reduce standard rates contracts caps. Late in March, the Oregon PUC approved Pacific Power’s request to reduce the eligibility cap for solar generation at QFs to three from ten MW, and a similar motion by Duke Energy was rejected by the North Carolina PUC late last year. As the price for solar generation continues to drop, we are expecting to see more PURPA driven PPAs across the nation. Whether PURPA PPAs will provide the necessary certainty and stability the market is currently lacking depends on FERC’s willingness to enforce its rules on avoided cost mandatory purchases, and Public Utility Commissions’ ability to withstand utility pressure to reduce standard contracts rates caps. Energy storage offers too many behind-the-meter benefits to consumers and grid operators to not become a common, if not essential, part of commercial PV projects. The myriad benefits of energy storage validate the basis of a beloved food analogy: “Energy storage is the new bacon—it makes everything better.”
The consumer-centric benefits are the most widely discussed, and they usually focus on shaving peak demand by reducing costly demand charges for commercial customers. In addition to mitigating demand charges, solar plus storage allows end users to benefit from time-of-use bill management, backup power availability, and increased PV self-consumption. Moving up the food chain, utilities can use energy storage to achieve resource adequacy, transmission congestion relief, and transmission deferral. Finally, Independent System Operators, or ISOs, benefit greatly from energy storage predominantly by increasing frequency regulation, but also via voltage support and energy arbitrage. PJM’s Atlantic-coast-to-Illinois territory became the first ISO to provide monetary incentives ($40-$50 per MWh) for grid-scale storage that directly addresses frequency regulation. On a related note, let’s talk about those scary “death spirals.” The U.S. energy storage market will be 8 times bigger in 2020 than it was in 2015, reaching 1.6GW of installed storage capacity. By 2020, the utility death spiral will have fully taken hold and grid defection will be occurring all over the country, right? I think not. In 2014, I contributed to a Rocky Mountain Institute paper called The Economics of Grid Defection, which seemed to briefly serve as a crystal ball for the nascent energy storage industry. But no more than two years after the report was released, even a modest amount of grid defection seems highly unlikely given the proactive efforts by utilities nationwide to design pilot projects and sustainable policies that integrate solar plus storage with existing grid infrastructure. The energy storage market will begin to resemble more of a shared economy rather than an increasing number of grid-defected silos. The availability of storage devices, both directly from the ramped up manufacturing as well as second-hand batteries from electric vehicles, will provide a sustained supply of storage assets to expand grid storage capacity. These are both compelling sources of affordable storage assets, and certainly a reason to believe the repeated headlines regarding anticipated drops in energy storage costs. The solar plus storage revolution is being driven by cost effectiveness and scalability, two key drivers that provide a strong signal for future growth. Navigating murky waters: Accessing the ITC for solar + storage projects It’s inevitable that developers compare the benefits of energy storage to the well understood benefits of solar PV systems. The reality is that the technology for deploying and optimizing energy storage is much more complicated than solar, which impacts the bankability and clear financing strategies needed for exponential capacity growth. Prioritized revenue streams from solar plus storage projects include basic kWh production from PV, in addition to the benefits derived from stored, dispatchable electricity when rates are peaking to shave off much more demand charges than solar could have ever done on its own. Aside from contracted revenue from the end user, determining the ability for solar plus storage projects to qualify for the 30% ITC (Investment Tax Credit) is a critical factor for getting projects to hit desired investment return thresholds. Solar plus storage installations qualify for the 30% ITC, but developers need to pay close attention to system design to ensure that the intended cost basis appropriately applies to the ITC’s rules and regulations. A few key insights include:
3/30/2016 What future Value of Solar policies could mean for the solar industry: 3 key things to knowRead Now There has been a wave of contentious net metering policy battles waged across the U.S. in 2016. Some net metering policies have remained largely intact, as in California, though much to the chagrin of the utilities. Other net metering policies, such as those in Nevada, have been fundamentally restructured, to put it kindly - though many would say they were just plain gutted. As with the ITC, a significant part of the solar industry formed around the net metering policy structure, and like many industries is reluctant to let go of such a foundational policy. But the aforementioned battles beg the question - is net metering the appropriate policy for solar looking to the future? Many believe that it has been a necessary stopgap policy measure, but not one that needs to live in perpetuity. One alternative that has been floated is the idea of a Value of Solar (VOS) policy that seeks to compensate solar based on a more nuanced understanding of the value that it provides to the grid. That is an easy enough idea to get behind, in theory, but just what could VOS mean for the industry? 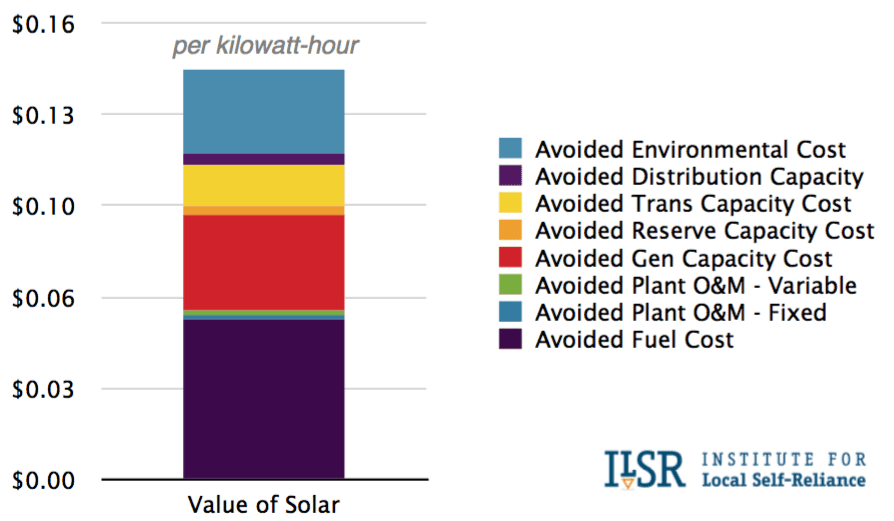 (Source: Institute for Local Self-Reliance)
Utilities and solar investors both come out on top with a VOS policy
Avoided costs hold the key to understanding how the “Value of Solar” is framed
Playing up the environmental costs angle could be the greatest strength of VOS
The City of Austin, TX and the State of Minnesota have led the charge on the initial VOS studies, and have proposed different cost structures and calculation methodologies. It would have been easy to anticipate that VOS would have taken off, especially as a substitute for the much-maligned net metering policies, but so far it has not. But if the recent solar policy battles are any indication, the days of the old net metering policies may be numbered. VOS may open the door for a more nuanced treatment of solar in our energy policy. For most EV businesses, the details of solar project development and operations are a related but distant world. Similarly, to solar developers and investors, the EV market is interesting, and most of them want to own a Tesla (including me), but integrating the two industries is a bit of a leap. However, some of us are wearing both hats. At IronOak, we simultaneously supply solar project investors and developers, as well as EV market makers, with research and transaction advisory services. In fact, at this moment, we are working on hundreds of MWs of solar projects and fleet roll outs totalling thousands of EVs in major U.S. cities. As one example, I serve as an Advisory Board member for Paul Allen’s Vulcan, Inc. in its innovative partnership with the U.S. Department of Transportation Smart City Challenge, which will award $50M to a single city to help electrify its transportation network. A report this month by the German Renewable Energy Federation highlights the massive potential link between the EV and solar markets. Estimates suggest that second-hand batteries from the world’s nearly 90 million EVs sold by 2030 could provide 1,000 GWhs of power in stationary uses such as integrating renewable power into grid, homes, and businesses. Apparently, when EV batteries get below about 80% of their original capacity, which occurs roughly 6-10 years after they’re first used, it’s time to replace them. Yet they might still have 10 years of life left. If true, this is important for two reasons:
For a sense of the scale of this opportunity, as well as how fast the cost of storage is falling, consider the graphs below, based on Navigant and Deutsche Bank projections. 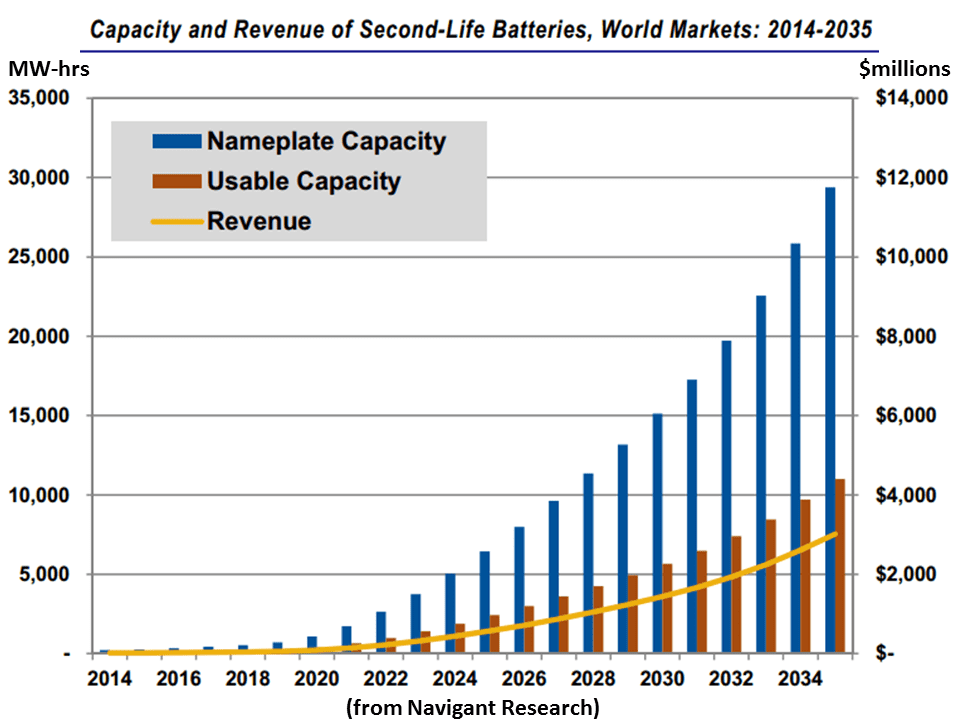 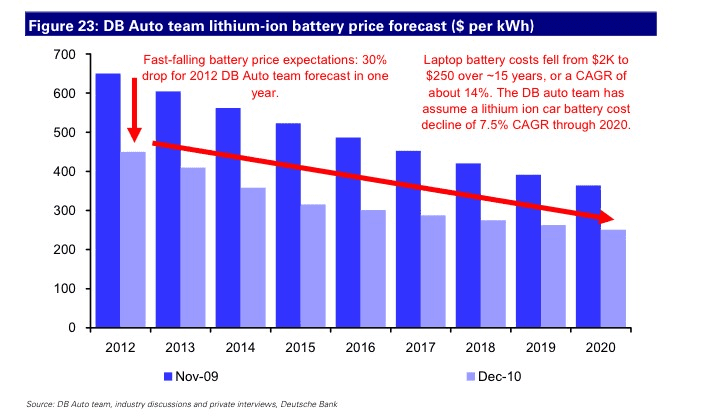 Revenue risk: More than amount and number of sources, it’s about certainty No surprise, investors and banks like some predictability—less for the former and more for the latter—in the revenues and costs of the projects they own. The same logic applies to energy storage investments. However, with at least 70 different battery chemistries being tested or manufactured at some scale, many believe that technology risk is the main barrier for battery roll out. Yet lithium ion batteries accounted for 96% of (chemical) storage added to the U.S. grid last year. As such, it’s the ability to forecast revenue, not remove technology uncertainty, that is the key to growing this nascent market. Scanning the figure from RMI below, it is clear that batteries provide many services at the transmission, distribution, and DG scales. One would assume that each of these would also create revenue for energy storage project owners. But you know what they say about assuming, right? The Urban Dictionary tells me that certain body parts are involved in the saying. 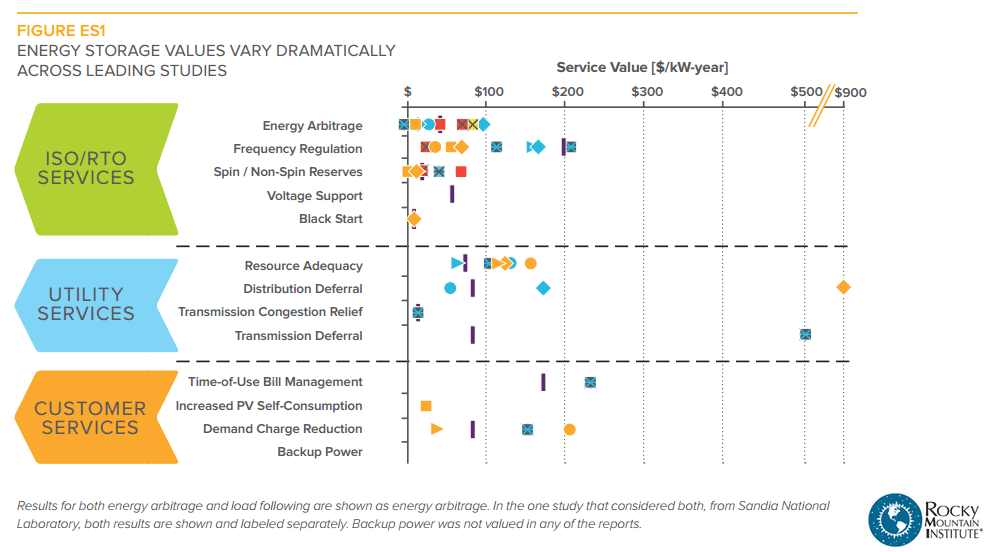 While the amount of potential revenue from multiple sources is appealing, it is not often possible in project structures. But it can happen. As an example, we have originated and are helping to underwrite a $100M-plus energy storage portfolio for a large international investor right now, and this projects makes financial sense because it is “stacking” several sources of revenue, and creating contractual certainty for some of these sources. To further illustrate this potential stacking of revenue, consider the November 2015 levelized cost of storage analysis by Lazard (below). They rightfully stress that their study does not look at revenue stacking, but this is exactly what is required to make more battery projects financially feasible. However, as I learned from talking to a public utility commissioner recently, utility regulations to allow more of these battery services to be monetized are not making it onto the radar of utility commissions because the market is still so small. Alas, we have a chicken and an egg... 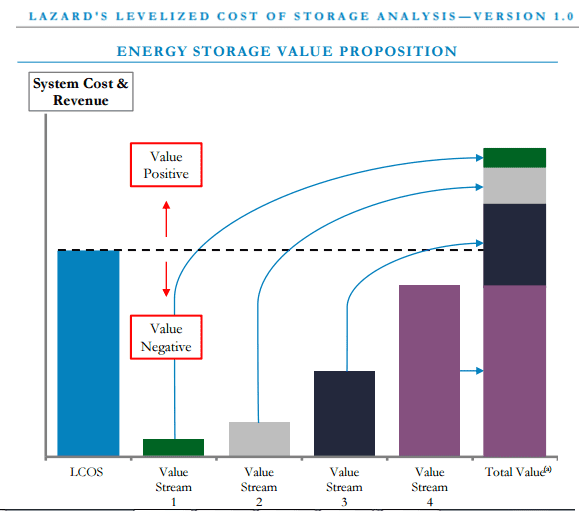 States with > 50 MW Non-RPS Utility PV in Development 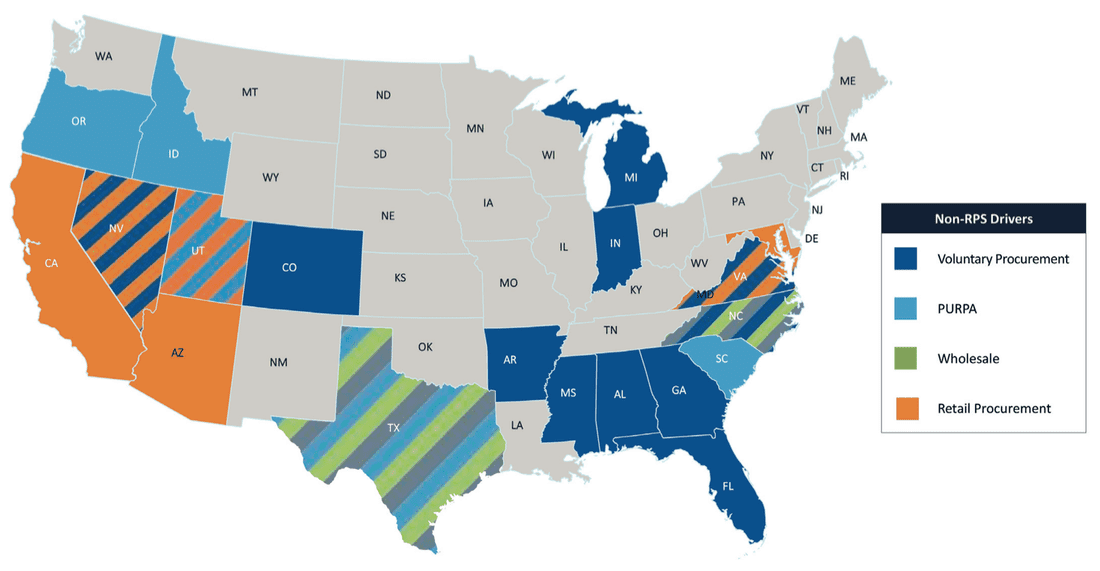 (Source: GreenTech Media)
Related data points:
Conventional wisdom says that the solar market is policy-driven, but this is changing in a big way The most vibrant and active solar markets are driven by Renewable Portfolio Standard (RPS) programs with supporting net metering and feed-in-tariff (FIT) programs, or so goes the conventional wisdom. California and Massachusetts exemplify this supposition, as their RPS programs undergird two of the largest utility-scale solar markets in the U.S. But evidence is mounting that the solar market will no longer be driven exclusively by RPS mechanisms. In 2015, 39% of utility-scale solar was procured using non-RPS mechanisms, and this is projected to increase to 52% in 2016. This begs the question - what is driving this marked shift? Falling costs are making solar more competitive with conventional generation The fact that solar has been undergoing rapid cost reductions is a borderline platitude at this point (see here for a good summary of key facts). Estimates for the average installed cost of utility-scale solar in the U.S. was $1.45/watt in 2015, with more reductions projected in the coming years. However, the real interesting question is how these cost reductions are changing the dynamics of competition across energy sources for utilities. Grid parity is considered the holy grail for utility-scale solar, and grid parity (or better) with prevailing natural gas prices has become a reality in many U.S. states (see here for some more detail on grid parity). This change in the market is making it real easy for utilities to make the simple economic argument that signing 20-year PPAs at below $60/MWh is not only the most prudent course of action from a bottom-line perspective, but also the best hedging strategy, which is discussed further below. This has also given rise to a new wave of avoided-cost contracts in states where solar is cheaper than conventional alternatives. This was enabled by PURPA (Public Utility Regulatory Policy Act), a landmark energy law from the 1970s that mandates that utilities purchase electricity from independent power producers (IPPs) if their cost is below the marginal cost of increasing the utility’s generation capacity through conventional means. This type of arrangement greatly reduces the risk of developing solar projects of a certain size, and has fueled the markets in states such as North Carolina. There is another big story behind the rise of non-RPS utility-scale solar related to the role of corporate PPAs, which you can dig into in a previous blog. The hedge against variable (and volatile) natural gas and coal fuel costs is attractive Many utilities are starting to see the writing on the wall in terms of their exposure to variable and volatile fossil fuel prices. Do not believe the hyperbole that oil and gas prices have reached a “new normal” with prices hitting lows not seen for many years (see a good discussion of peak oil here). We are likely amid an anomalous period of low petroleum prices brought on by a confluence of factors - namely, historically high oil prices prior to the 2008 recession which escalated investment in exploration, and cheap financing made available through low interest rates. The current oil and gas low prices are undercutting the ability of firms to invest in exploration, which will eventually erode the current surplus and lead to future deficits and much higher prices than we see today. As discussed in a previous blog, even the most conservative projections of future natural gas prices has them increasing, with many projections substantially above current prices. The future of coal is a more complicated matter, but suffice it to say that any utility which maintains coal as a primary long-term energy procurement strategy will be taking on a great deal of policy and financial risk. When seen from this perspective, any rational observer of the U.S. utility sector would naturally conclude that they need to invest heavily in hedge strategies to protect against the inevitability of volatile and unpredictable fossil fuel prices. As many utilities have gained exposure to and comfort with solar PPAs as a compliance mechanism to meet RPS targets, it started to dawn on them that there could be substantial benefits to using PPAs as a hedging strategy. As a consequence, we are now witnessing a boom of procurement taking place outside of the RPS-driven solar markets, at least partially driven by the desire to increase their portfolio of low-risk electricity generation from solar PPAs with predictable rates for 10-25 years. It seems somehow fitting that utilities are increasingly more willing to exchange their variable-priced fossil fuel capacity for variable-generation solar capacity. Further reading:
The latest U.S. Solar Market Insight Report from GTM Research and the Solar Energy Industries Association reveals that the U.S. installed a record 7.3 GW of PV capacity in 2015, with solar installations surpassing natural gas capacity additions. Overall, solar accounted for 29.5% of all new energy capacity additions in the U.S. in 2015. U.S. Solar PV Installations, 2000-2015 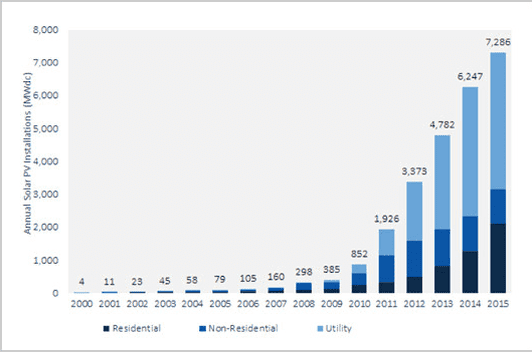 (Source: GTM Research / SEIA U.S. Solar Market Insight Report) Among the different solar sectors in the U.S., residential PV has been the fastest-growing market segment, expanding by at least 50% over the past three years and 66% in 2015. By Q1 2016, the number of U.S. homeowners with rooftop solar is expected to cross the 1 million mark. Indeed, the falling costs of installation paired with rising retail electricity rates make residential solar economics increasingly attractive in a growing number of states. A GTM study released in February found that 20 U.S. states have reached grid parity for residential solar. However, the increase in rooftop solar installations and the accompanying rise of net energy metering policies have revealed several issues underlying high penetrations of solar, among them:
In response to these concerns, and especially the concern among utilities that a decline in sales will generate insufficient revenue to cover the fixed costs of maintaining the grid, some utilities have suggested imposing higher fixed charges on their customers as a method to recoup costs. In 2015 alone, 61 utilities in 30 states requested public utility commissions to increase fixed charges, making it the most frequent policy proposal impacting distributed solar in the last year. 21 utilities in 13 states proposed adding new or increasing existing charges specific to residential solar customers, with the median requested increase at $5 per month. While seemingly a “quick fix” for utilities’ declining revenue concerns, fixed charges do not vary with usage and cannot be avoided with energy net metering credits. Thus, higher fixed charges significantly reduce the financial value of installing solar PV systems. Moreover, fixed charges harm low income and low usage customers and they fail to provide accurate price signals to customers, thereby reducing customer incentives to save on energy use. Research institutes, think tanks, and regulatory agencies have suggested other approaches to address concerns associated with net energy metering in high solar penetration states, among them: time-of-use pricing, smart metering, locational marginal pricing, minimum bills, and revenue decoupling. These suggestions are currently being weighed by legislators and public utility commissions in at least 27 states. Unfortunately, rate review processes are lengthy, and in the meantime the solar industry is paying the price for policy uncertainty. After the Nevada Public Utility Commission’s controversial December 2015 decision to slash net energy metering, many residential solar installation companies halted operations in Nevada, with giants like SolarCity and Sunrun exiting the state. This month, Massachusetts reached its net metering and REC caps, halting operations of solar developers and installers in a state that has more solar jobs than any other state except California. Recent Action on Net Metering, Rate Design, and Solar Ownership Policies 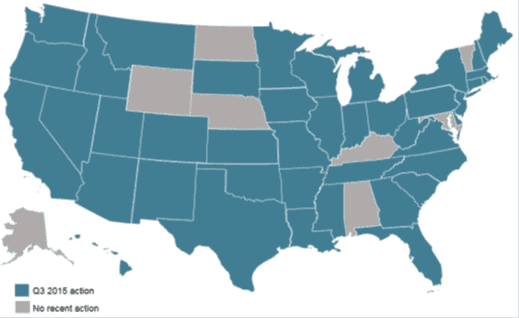 (Source: N.C. Clean Energy Technology Center, 50 States of Solar: A Quarterly Look at America’s Fast-Evolving Distributed Solar Policy Conversation.) One state that has remained below the solar radar is suggesting a new approach for addressing solar rate design concerns. Maine’s new proposal for replacing net energy metering with a market aggregator is making ripples in the solar policy world for its innovative ratepayer-focused approach. The proposal contemplates the creation of a market aggregator that would purchase energy, RECs, capacity value, and ancillary services potential from distributed energy generators at a fixed per-kWh rate guaranteed under a 20-year contract. Centralizing procurement is supposed to reduce transaction costs and create new opportunities for the aggregator to sell the different attributes solar energy provides in applicable markets. Based on a Maine Public Utility Commission March 2015 study that estimated the value of distributed solar at $0.337/kWh, the proposal suggests a starting purchase price from distributed energy generators of $0.20/kWh, higher than the current net energy metering rate ($0.13/kWh) but lower than the $0.337/kWh Maine value of solar estimate. The Public Utility Commission can set a different rate (higher/ lower) based on market conditions and other criteria (there is a lower rate for small commercial projects of 1 to 5 MW). For the wholesale distributed generation market, the aggregator will conduct a quarterly reverse auction for specified levels of installed capacity, with the lowest offer winning a purchase contract from the aggregator who then sells the energy and attributes in the applicable markets. The program is hailed by solar advocates, utilities, and regulators as meeting the needs of all stakeholders involved. Solar customers enjoy rate certainty for a period of twenty years, which is the common term for solar equipment financing. At the same time, all ratepayers are set to enjoy the revenues from the sale of the aggregated energy and attributes in wholesale markets, which are to be allocated equally across the entire rate base. Overview of Market Transactions 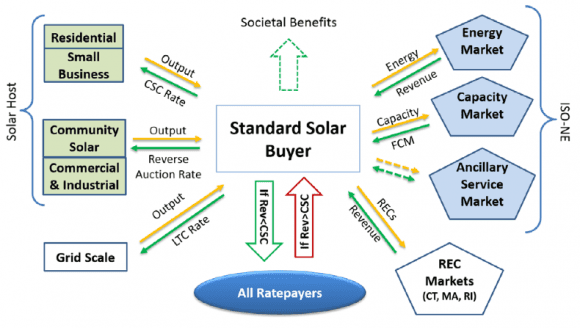 (Source: Strategen, A Ratepayer Focused Strategy for Distributed Solar in Maine.)
The bill incorporating the new solar program was endorsed by a bipartisan group of lawmakers, environmental organizations, utilities, solar installers, and consumer advocates. According to the bill’s sponsors, the new program will not only boost Maine’s solar industry but also save $100 million for ratepayers. For those who thought that community solar marks the second revolution in the solar market, Maine’s promising new solar purchase program serves as another example of how aggregation of solar generation and attributes could increase returns for all parties involved. The emerging lesson from these two examples is that with solar energy, economies of scale could be achieved without unnecessary investments in large and expensive infrastructure. Innovative market models and creative policy approaches will determine the next leaders of the solar world. Yes, we agree - energy storage is confusing. There are over 70 new battery chemistries being tested or manufactured today. And batteries are just a subset of energy storage more broadly; remember flywheels, pumped hydro, and compressed air? Consider the fun graph about technology maturity on the following page to be further confused. However, if you are providing financing, guarantees, or warranties for energy storage systems, note that the market has validated just one battery technology: Lithium-ion. This chemistry made up 96% of all 2015 energy storage installations by capacity. This is not to say, however, that your energy storage investment strategy over the long term is without risk. Consider three supply chain risks regarding lithium. These may cause a shift to other battery technologies, such as flow batteries: Source: Depending on the year, very little lithium is harvested in the U.S. Moreover, production is controlled largely by just 3 - 4 major companies, which some refer to as an oligarchical structure. Energy Storage Technology by Maturity 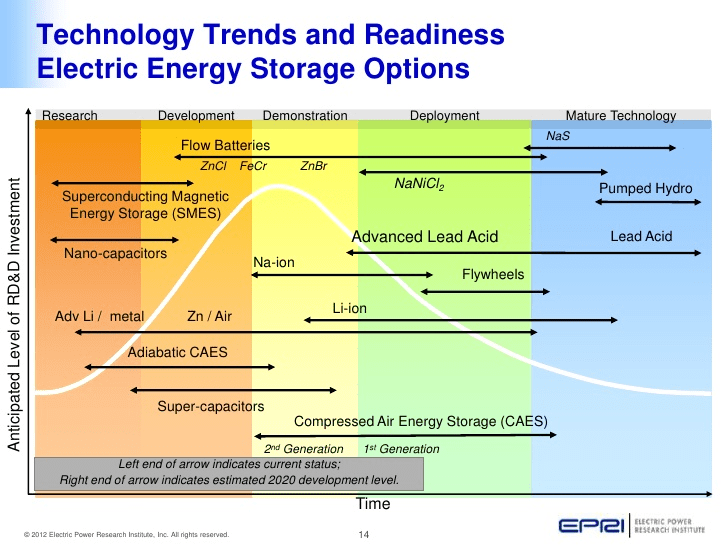 (Source: EPRI) Demand: Global demand for lithium is expected to grow 2x by 2025; as one example, Goldman Sachs suggests that new Tesla Gigafactory alone could consume 17% of current supply. Consider the graph on the following page showing the link between electric vehicle market growth and falling battery costs, which make up ⅓ of car costs. Supply: There is no shortage of lithium reserves. According to the USGS, even if the world increased lithium production 3x from today’s levels, we would still have 135 years of supply. However, what we care about is not reserves but instead the amount of lithium that can be brought to market in time to match the rapidly growing demand from energy storage for grid management, peak shaving, smartphones, laptops, and the many other uses for this precious mineral. And experts suggest that supply will stay below demand for years to come. Lithium Production by Country 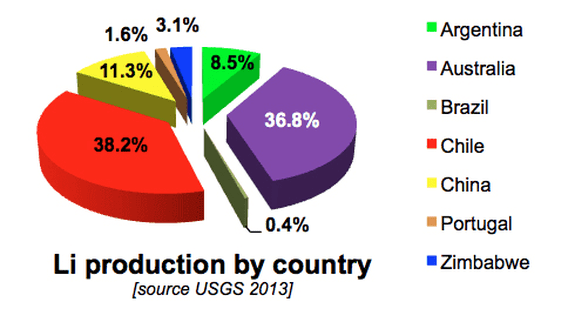 Source: U.S. Geological Survey Falling Lithium-ion Battery Packs (left) vs. Annual Demand for EV Battery Power (right) 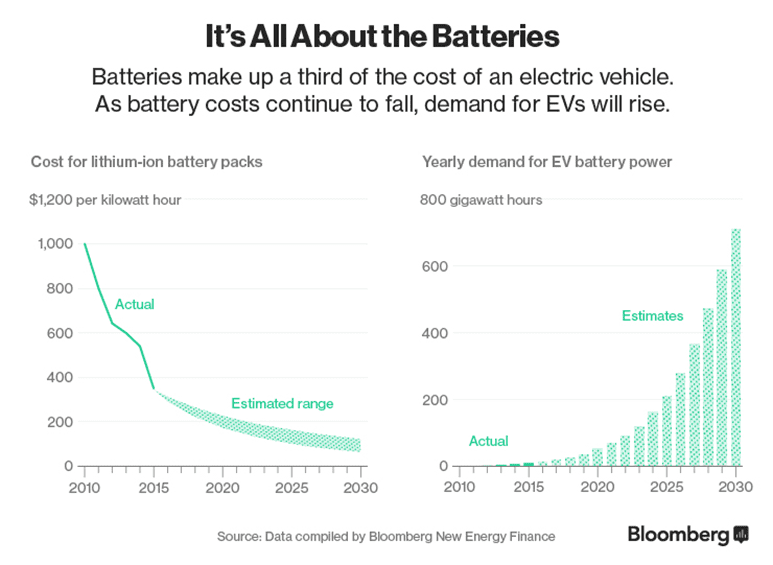 Energy storage investment opportunities are vast, but they are not all the same First, let’s take a look at the big picture: Consider GTM’s U.S. energy storage highlights from 2014 and 2015 (on the next page). Here are five things that stand out:
Energy Storage Scorecard 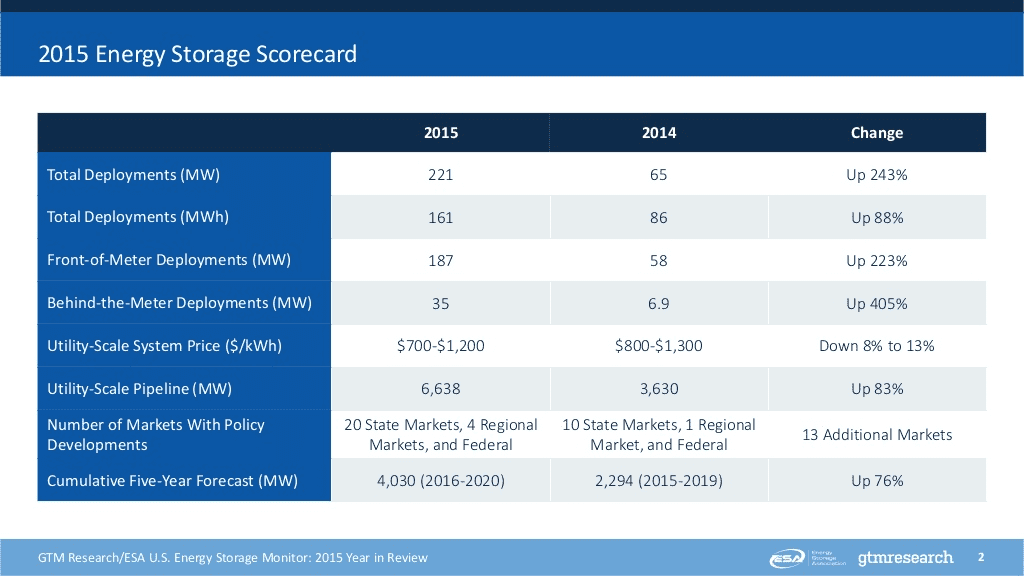 (Source: GTM) As another source of variation in this market growth, consider the graphs below and on the next page. While utility-focused systems dominate today, by 2020 the split becomes more comparable among utility, commercial, community, and residential applications of energy storage. Energy Storage Investment by Sector: 2012 to 2020 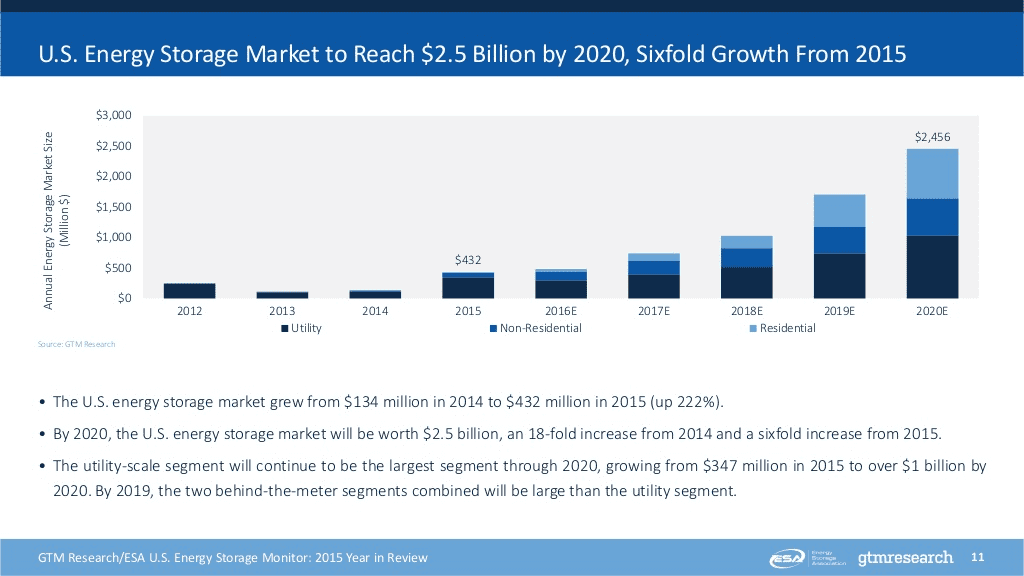 (Source: GTM) Energy Storage Investment by Sector: 2014 to 2024 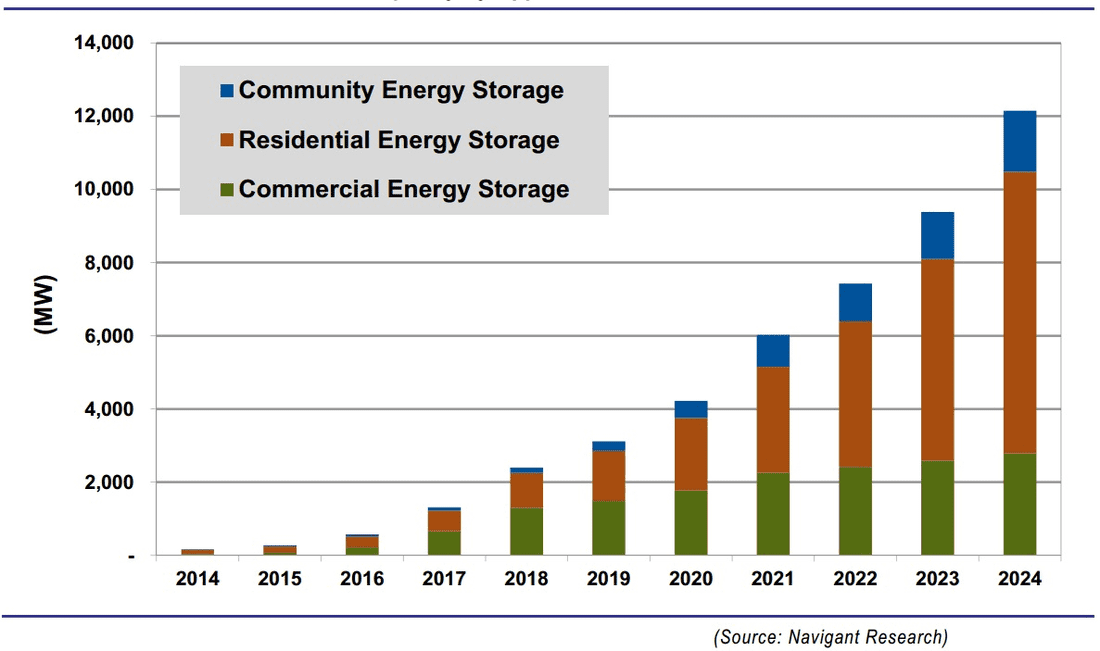 (Source: Navigant) Lastly, consider how energy storage investment opportunities vary based on the type of service provided at the utility level (graph below). The type of service most needed will also vary by state and utility, and drivers will be tied to policy, unregulated versus regulated market structures, degree of deferred grid investment, and a host of other factors. Navigant projects that revenue from this sub-market will exceed $15B by 2024. Energy Storage Capacity by Grid Service: 2014 to 2024 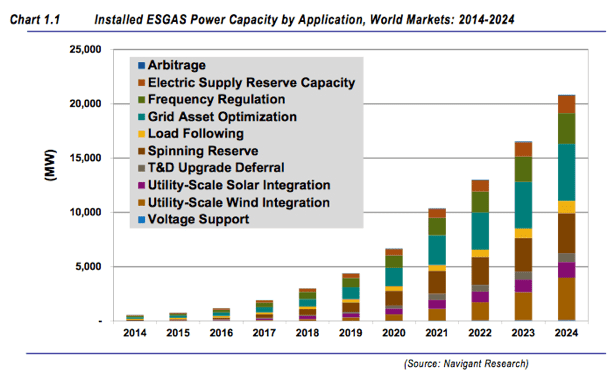 (Source: Navigant)
|
sign up for ironoak's NewsletterSent about twice per month, these 3-minute digests include bullets on:
Renewable energy | Cleantech & mobility | Finance & entrepreneurship | Attempts at humor (what?) author
Photo by Patrick Fore on Unsplash
|
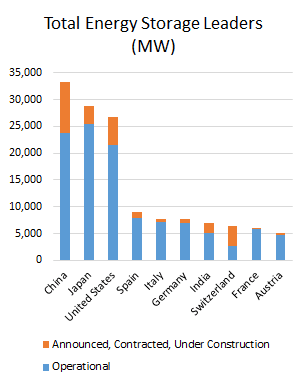
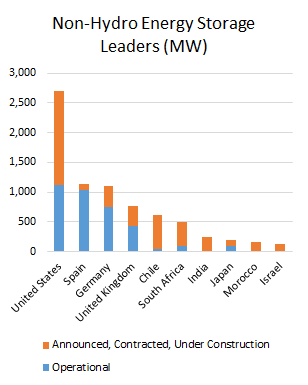

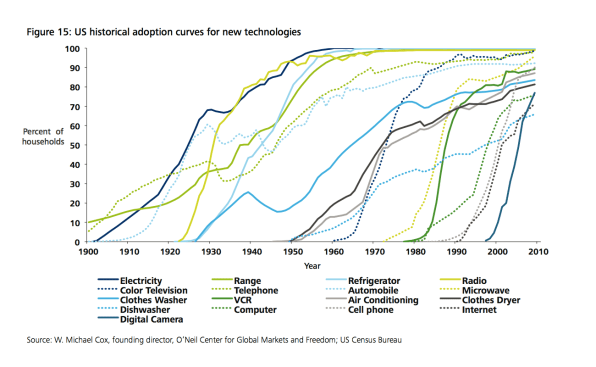
© 2009-2022 IronOak Energy Capital, LLC | (888) 249-3013