
|
Related data points:
In June 2015, six months before Congress extended the solar ITC beyond 2017, GTM Research predicted that by 2020 community solar will be a half-gigawatt annual market. With the new ITC extension, the recent IRS private letter ruling on community solar, and EPA’s Clean Power Plan gradual march forward, more and more actors in the solar industry are starting to realize the prospects created by community solar programs across the country. Indeed, community solar could well mark the second revolution in the solar market. For those who have missed the rooftop solar revolution, community solar could be the second chance to get on the solar train. 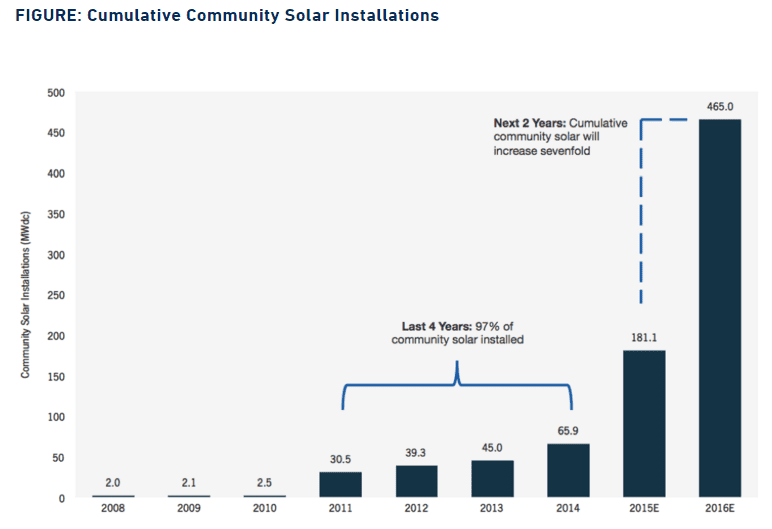 (Source: GTM Research) Why community solar and why now? A relatively new concept in renewable energy, community solar allows customers who might find solar panels to expensive or impractical to install on their property to enjoy the benefits that come with owning solar panels without the need to install a solar facility on their property. The primary purpose of community solar initiatives is to reduce member costs and risks through a joint investments scheme in a community solar facility to be located in a suitable location in proximity to the contracting community. By aggregating customer-generators, project participants could benefit from the electricity generated by the community solar farm, which costs less than the price they would ordinarily pay to their utility. With somewhere between half to 85% of electric consumers in the U.S. unable to install solar panels because they don't own their home, don't get enough sun, or don't have the required financial resources, community solar represents a huge, mostly untapped market waiting to be grabbed. Unfortunately, as with every new market, uncertainties are abound. It is therefore not a coincidence that the states with the most community solar projects are generally the states that have addressed investor concerns through strong enabling legislation. These states include Colorado, Minnesota, Massachusetts, and Vermont. Other states are rapidly catching up, and currently 15 states and the District of Columbia are contemplating or have already introduced community solar programs through legislation. Unfortunately, state programs differ widely, and some programs do not offer the same level of investor certainty as others. 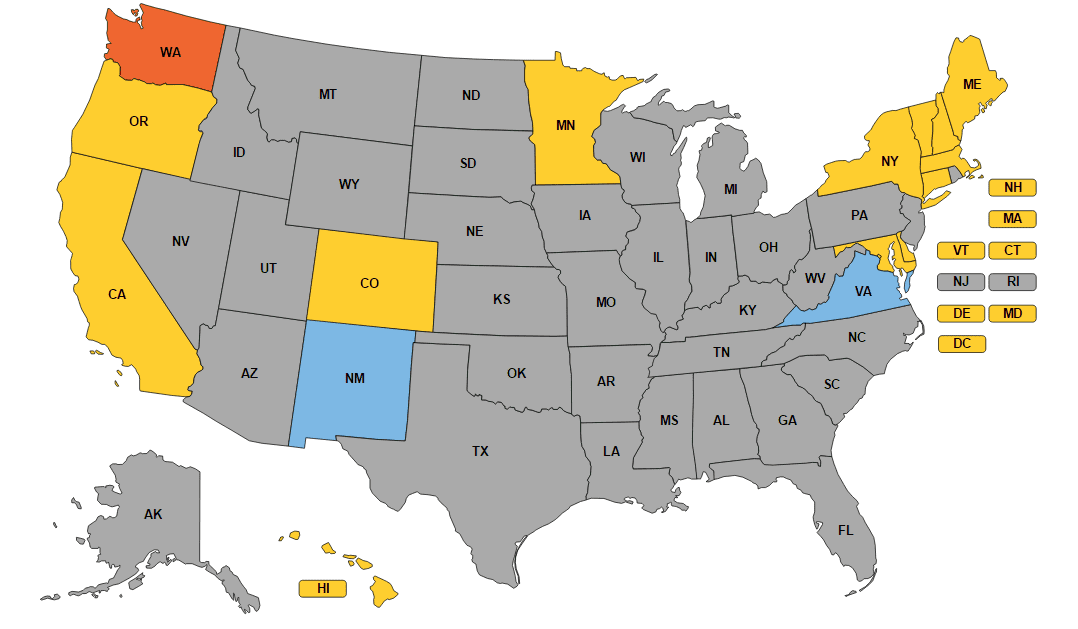 (Source: Shared renewables (in blue: pending legislation))
Addressing investors’ concerns In comparison to traditional distributed energy projects, community solar initiatives pose a heightened credit risk. Multiple members with varying degrees of creditworthiness make investors uneasy, to say the least. Moreover, restrictions on exit make community solar unattractive to potential members who have only a small stake in the project and are therefore wary of signing contracts that impose penalties on members who leave the community; while the potential for high member turnover scares investors away. Add to this the usual concern that multiple parties to a transaction mean higher transaction costs, and the reason why investments in community solar are hard to come by becomes clear. However, an in-depth assessment of community solar schemes across the U.S. reveals that several states have done a remarkable job addressing these concerns, making investments in community solar in their jurisdiction not only relatively safe but also quite attractive. To ease operations and reduce transaction costs, Public Utility Commissions in New York, Maryland, Minnesota, and Colorado have introduced an intermediary special purpose entity (SPE) responsible for aggregating membership interests and managing the relationship with the local utility. Thus, instead of contracting directly with the residents in the community, the utility enters into an agreement with the SPE which serves as the project’s manager. The SPE aggregates members and collects payments; provides the utility with member information; and distributes excess credits to members (or instructs the utility how to distribute excess credits). To allow flexibility and innovation, the states left it to sponsors and potential members to determine the terms of their contractual relationships, including conditions for removal and replacement of members. The SPE structure makes member replacement fairly easy. Since utilities are engaged with the SPEs and not individual members, they are agnostic to member exits and replacements. When it comes to removing, replacing, or adding members, the SPE’s sole responsibility is to notify the utility of the change in a timely manner. While not as flexible, other states took a fairly close approach to reducing risk associated with multiple members. New Hampshire, Massachusetts, and Delaware require that the community designates a “host” member with an ownership interest in the solar facility to contract with the utility, administer group relationships, instruct the utility on credits allocation, and control membership structure. Vermont’s community solar scheme is not run by a utility or third-party SPE. Instead, members are free to organize themselves, stipulating their own process for allocating the generation credits among their accounts. The program’s flexibility is hailed as attracting investments in community solar, but projects are only attractive when the terms of subscriber contracts allow for immediate termination of defaulting members. In other states, programs are either overly restrictive (Maine, Washington), are still in the works, or undergoing revisions (Connecticut, Virginia, Oregon, DC, Hawaii, California). What’s next? Through our work with interested investors and qualifying developers, we have come to appreciate the market potential for community solar in the seven “leading” states (New York, Maryland, Minnesota, Colorado, New Hampshire , Massachusetts, Delaware, and Vermont). However, strong opportunities do not mean zero risks. Although the regulatory environment in these states makes it easier for community solar administrators to mitigate risks associated with multiple members, in practice finding and contracting with an alternative member is contingent on the characteristics and contractual terms of the specific project. A profitable project with a simple member replacement mechanism should not experience difficulties in recruiting new members to replace those who defaulted. To ensure that a project is investment-worthy, developers and administrators are therefore advised to include terms in solar community agreements that allow for the immediate termination of defaulting members’ subscription even if such language might mean an initially harder-to-market project. In addition, developers should restrict member subscription, reserving a pool of unsubscribed interested and potential members in the community for future member replacements. From an investor perspective, investors should carefully examine developers’ subscription and management contracts, verifying that administrators and hosts have adequate measures for addressing the risks associated with multiple members. 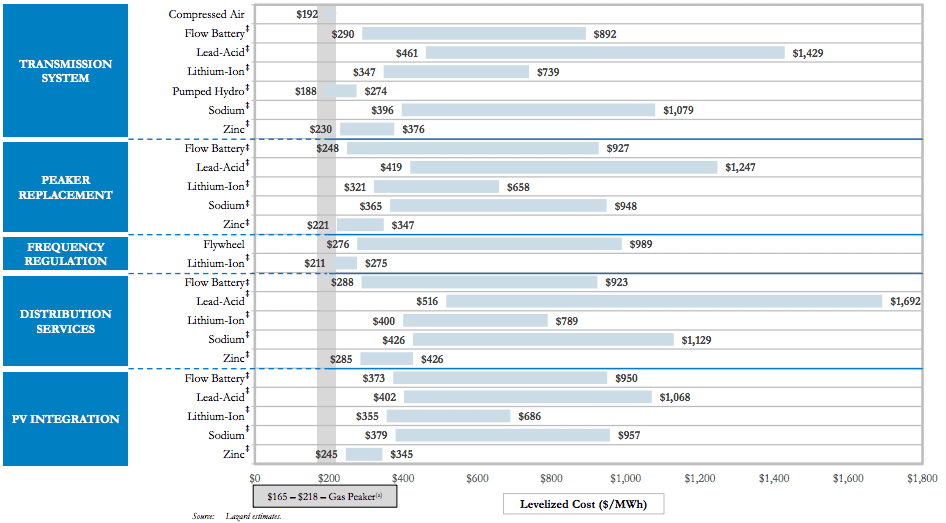 (Source: Lazard)
Related data points:
Energy storage must blaze new trails in bundled service business models in order to succeed In many ways, the economics of storage bears little resemblance to the economics of solar. Solar has undergone a remarkable jump up the technology learning curve, resulting in cost reductions that few predicted a decade ago. Solar electricity generation has characteristics that make it difficult to make a pure comparison with conventional generation. However, solar costs can be framed in terms very familiar to the energy industry: levelized cost of electricity (LCOE), power purchase agreement (PPA) rates, installation costs per watt, etc. Looking through this lens, we could see when and where solar approached grid parity, or the point at which there is no discernable cost difference between solar and incumbent technologies. The solar story was easy to tell - the technology could be relatively easily integrated into the current grid system, and the business models underpinning solar were eventually easy enough to grasp for consumers and the financial industry. This all drove the virtuous cycles of deployment, learning, and improvement that has placed solar squarely as the electricity source of choice for the future. The storage story, in contrast, is much more nuanced. Of course, at a high level, we can paint a similar picture as that of solar. We draw upon studies like Lazard’s, which provides some nifty levelized cost of storage (LCOS) comparisons for storage technologies across different applications (there is contention that levelized cost methodologies undervalue storage). Essentially all storage technologies in any application are outcompeted by natural gas peaker plants on a purely $/MWh basis. Two notable exceptions are with pumped hydro in the transmission system and lithium ion batteries for frequency regulation. Despite the fervor around battery technologies, it should be pointed out that the tried and true pumped storage technology is still, by far, the dominant storage technology in operation, comprising over 90% of installed capacity worldwide. But without some dramatic reductions in levelized costs for battery technologies, we are unlikely to see widespread adoption of storage technologies. Or will we? This is where the nuance in the storage story comes in. On the one hand, the cost of battery storage is projected to follow a similar downward trajectory as solar. Projections abound claiming anywhere from 25% to 70% cost reductions over the next 5-15 years. What is not to like? To put it simply - unmonetized value. On the other hand, there are a multiplicity of services that storage provides to customers, utilities, and grid operators (13 according to the Rocky Mountain Institute) for which there are no proven compensation schemes. For storage to break into the market in a meaningful way, it will need to move into bundled service business models. Getting beyond using energy storage for just demand charge reduction, backup power, or increasing solar self-consumption (which often only utilizes the storage system for a fraction of its lifetime capacity) to a stacked service model that also provides, for instance, frequency regulation, resource adequacy, or energy arbitrage services to the grid would open an incredible array of opportunities in which storage does not currently make economic sense. This is, however, no simple task. It will require time, experimentation, failures, and ultimately some successes to arrive on a spectrum of business models that can help unlock the vast potential of energy storage. The economics of storage works in certain niches, but the market needs stronger signals It is not altogether unfair to see some of the hype around storage as hyperbole. The technological optimists among us see a technology on the brink of unlocking a world of potential in the energy sector, and for more than just variable generation renewables. The skeptics might see the storage story through a somewhat different lens. Energy storage is not monolithic, comprised of a narrow range of market tested technologies that work at commercial scales. Rather, there is a staggering array of technologies, many in the R&D and demonstration phases, all competing to gain some traction in commercial markets. Picking the winners and losers out of this maelstrom is a tall task. And yet, VC investment in energy storage startups has fluctuated dramatically since its peak of $876M across 59 investments in 2011, according to CB Insights. There is clearly some concern about technology risk and market timing, given the sprawling field of energy storage technologies in development. However, the energy storage policy landscape leaves much to be desired. Grid policies have been slow to react to the growing promise of storage. Legacy net metering policies, while beneficial for generation technologies such as solar, are not well-suited for storage technologies that require the accounting for two-way energy flow. Ahead of many policy changes at the grid level, we can only hope to see more mandates such as California’s (1,325 MW of storage by 2020), which can clarify the way in which regulatory and grid policy must adapt. Without this high-level market signal, rate structures and other market restrictions may place a low ceiling on near-term energy storage deployment, especially grid-connected storage. In the meantime, behind-the-meter storage may be the best place to look for scaling up deployment, as customer-sited storage allows the users to capture the benefits of self-consumption, backup power, demand charge reduction, and time-of-use bill management, among others. Interestingly, behind-the-meter storage applications are rarely the least cost option, but offer a compelling return-on-investment proposition for enterprising customers. Yet, even these investments are leaving a lot of money on the table under current regulatory models and grid restrictions that prohibit behind-the-meter storage from providing grid services. Let’s hope that antiquated policy and market structures stymie the rapid progress needed in the energy storage market. Further reading:
Global Megawatt-Scale PV O&M and Asset Management Competitive Landscape 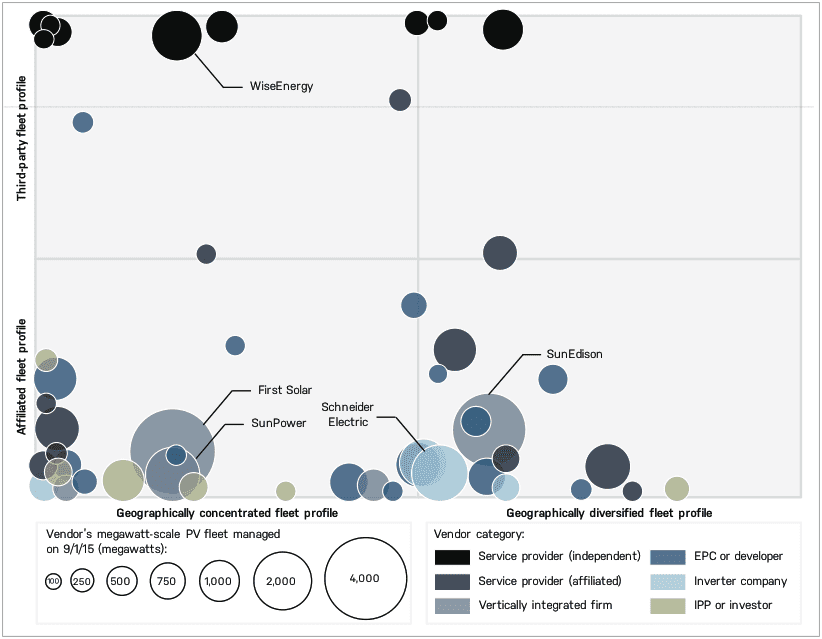 (Source: Greentech Media)
Related data points:
U.S. solar investment and deployment will continue the charge forward, but not everywhere Clean energy investment reached a record $329B globally in 2015, $56B of which took place in the U.S. The international and national policy winds are all pushing in favor of further accelerating clean energy investment in the coming years. However, there is more complexity at the level of local politics with entrenched utilities and PUCs. Do not underestimate the ripple effect of the conflict on solar policy in Nevada. A class action lawsuit was recently filed in protest of the draconian sanctions imposed on the solar industry and homeowners who had invested in solar systems under a now defunct incentive structure. Add the Nevada dispute to the growing list of local conflicts in Arizona, Hawaii, Colorado, and Minnesota, and a clearer picture of just how embattled the solar industry has become in many places around the country becomes clear. It is curious that so many conflicts are emerging despite the fact that the vast majority of Americans support solar across the political spectrum. An excellent analysis of these “niche-regime” conflicts was recently published by Dr. David J. Hess of Vanderbilt University, which concluded that we can expect continued resistance from incumbent (“regime”) utilities and PUCs that perceive the solar industry (“niche”) to be a threat to their way of doing business, especially in geographies where the solar industry is associated with a political party that is not well represented in local governing bodies. As a result, we may start seeing a more fragmented landscape of solar investment and deployment activity in accordance with the level of local policy support or resistance. Solar investors and developers, who tend to be very sensitive to the policy drivers that underpin their business strategies, will need to remain ever-vigilant of local and state policy, even in the context of the extended solar ITC. That being said, agile solar developers that can quickly adapt to the shifting solar policy landscape, especially in emerging markets, will have a leg up on the competition. Solar development will experience a downtick in 2016, but it will be good in the long-run According to SEIA, the ITC extension will lead to more than 72 GW of solar PV installations from 2016 through 2020, an increase of over 25 GW (or 54%) over baseline expectations without the extension. However, with the pull effect of the solar ITC cliff at the end of 2016 diminished, there may be less solar installation in 2016 than was previously projected. In fact, growth in the solar industry may slow in 2016 to an estimated 8% according to S&P in 2016, compared to the over 20% growth seen in 2015. While this may have negative ramifications for the near-term cash flows generated by some solar companies, and by extension the valuation of some publicly traded solar companies, it will be beneficial for project investors. The smoothing of solar policy support and hence development over the next 5 years will allow for more prudent investment that can generate better long-term returns. There will be more room for patient capital, and investors willing to do the research and diligence to identify good investments for their risk tolerance. The race to the end the solar industry’s dependence on the ITC has gotten moved into the 2020s, a point at which solar will hopefully no longer needs tax equity in order to make sense in most geographies around the U.S. While solar policy and finance dominate the headlines, solar technology will continue up the learning curve Since the implementation of the ITC in 2006, the cost to install solar has dropped by more than 73%. Across the U.S., the average total project cost for solar is hovering around $2.42/watt for non-residential and utility-scale installations. That is what is often meant by the technology learning curve: decreasing system costs. With all of the focus on how rapidly solar has gotten cheaper, some focus has been taken away from how much better the technology is getting. Just over the last 5 years, solar modules have experienced a massive proliferation of technologies, which are pushing the bounds of efficiency and performance. A compelling graphic of the state of solar module technology produced by NREL suggests that previously unheard efficiencies of 30% and higher are now feasible in laboratory settings, and some of these are ripe for commercialization. The crux of the matter, of course, is how cost efficient these cutting edge solar module technologies can be. If commercial solar module technologies can achieve a bump in efficiencies at a price that the market can withstand, we could see some dramatic improvements in solar project finance. The US DOE’s SunShot program is trying to accelerate the deployment of the new generation of commercial solar module technology with their recent announcement of a $22.7M investment across 23 promising projects. Even if we take the cutting edge technologies off the table, the most prevalent types of solar panels being deployed, crystalline silicon and thin-film panels, have become much more efficient in recent years. So, amid all of the hoopla about solar deployment, let’s not lose sight of the horizon for solar module technologies. Further reading:
|
sign up for ironoak's NewsletterSent about twice per month, these 3-minute digests include bullets on:
Renewable energy | Cleantech & mobility | Finance & entrepreneurship | Attempts at humor (what?) author
Photo by Patrick Fore on Unsplash
|

© 2009-2022 IronOak Energy Capital, LLC | (888) 249-3013