
|
Annual U.S. Energy Storage Deployments, 2012-2020E 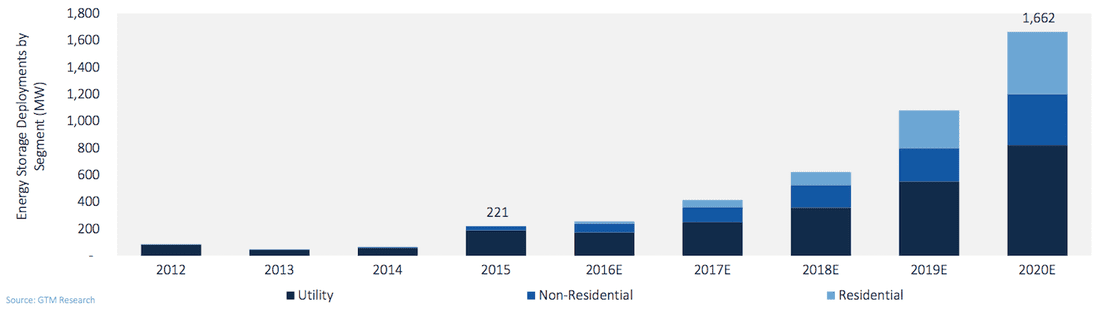 Can somebody throw the energy storage industry a bone? It is a little known fact that the investment tax credit (ITC) was a key catalyst for the emergence of solar as an essential component of the future electric grid. Well, not really. That statement borders on platitudinous. It should be no surprise, then, that the energy storage industry is angling for similar treatment by the almighty tax deities at the IRS. Energy storage, after all, is touted as being a key enabler of high levels of renewable energy penetration. Handcuffing energy storage will only undermine the grid integration of solar and wind down the line. So, can the energy storage industry get a bone here? Yes, it is a relatively nascent industry (at least in battery technology) undergoing a rapid period of technological learning and experimentation. But out of the frey, we are starting to see some dominant technologies and applications emerge within functional markets. While lithium ion batteries are the current industry darling, there are many other viable storage technologies including stored hydropower, which still dominates the energy storage field overall. In the periphery, there are a host of other storage technologies incubating in R&D facilities, start-up companies, and corporate technology giants. Perhaps in response to the eventuality of energy storage becoming a key component of the electric grid, the IRS threw the energy storage industry a bone, but it came with some strings attached. Energy storage already qualifies for the ITC, right? Yes and no. Yes, energy storage already qualifies for the ITC, but no, it is does not qualify under all circumstances. Energy storage that is powered by solar or wind qualifies for the ITC, though with some caveats related to the extent to which grid electricity is also used to charge the energy storage system. This is where things get a little tricky. Assume that you have an off-the-grid solar + storage facility (a grid defector!). Simple - the ITC applies, and you can get on with your homesteading. But for all grid-connected systems, there is an upper limit to how much charging your storage system can receive from the grid and still qualify for the ITC. That magic number happens to be 25%, meaning that a whopping 75% of energy storage charging needs to come from solar. That is just the minimum standard for qualifying for the ITC. The full ITC benefit is reduced in proportion to the amount of energy input coming from the grid, so anything less than an energy storage system charged by 100% solar will receive less than the full ITC benefit. Add to string the fact that solar + storage projects are benchmarked to the first year’s solar power output for the subsequent four years of the tax benefit, which means that any reduction in solar output will be penalized with a lower ITC benefit. And all of this was articulated in a private letter, which does technically establish a precedent, but is a somewhat opaque way to communicate what could be a substantial benefit to the energy storage industry. See here for a clever dive into the details of solar + storage. Stand-alone energy storage ready for an ITC vaccination It is clear that coupling solar (or wind) with energy storage is a good idea, and will be done with increasing frequency over time. It is also clear that energy storage will not and should not be relegated to the sidelines of the ITC prom waiting for some attention from the solar and wind dancers on the floor. In fact, it is imperative that energy storage be granted a clear and clean invitation to the ITC prom independent of their relationship to solar and wind, when and where appropriate. If the aim is to reduce barriers to more energy storage development providing flexibility and ancillary services to the grid, then there is a pretty obvious argument to be made about the need for a little ITC vaccine for stand-alone energy storage. Why a vaccination? Well, energy storage, like many emerging clean energy and smart grid technologies, could benefit from an inoculation against investor skepticism. There is no shortage of bullish projections about the future of energy storage, yet many project developers find themselves searching for capital. Even when they land upon a willing investor, their investment often comes with a heavy cost of capital penalty due to the perceived risks and uncertainties associated with energy storage projects. Not unjustified on the part of the savvy investor in search of those ever elusive risk-adjusted returns. But also not the formula for ramping up energy storage deployment, which, after all, is the key to sussing out technologies, business models, and financing structures. Learning, in other words, which is exactly what the ITC has been doing solar all of these years. Roping in stand-alone energy storage projects into the ITC framework could be just what can get investors over the hump of really going gangbusters on energy storage. SolarCity Residual Cash Flows 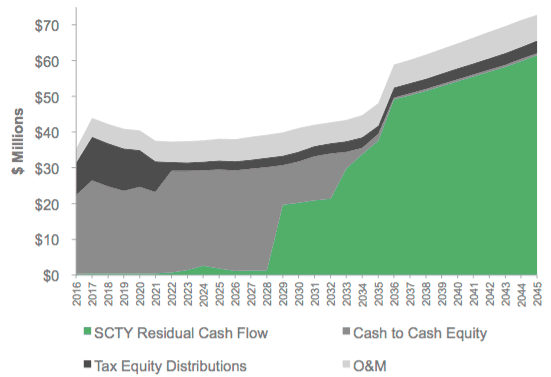 (Source: SolarCity) SolarCity is still the prettiest girl at the dance SolarCity is without a doubt the most trend-setting solar finance company on the planet. They are a vertically-integrated, distributed solar superpower that seems to grab newsworthy headlines on a weekly, sometimes even daily basis. On April 6th, SolarCity announced a $150 million non-recourse financing facility with Credit Suisse to support the deployment of new commercial PV and energy storage assets. The very next day, the company announced a tax equity closing of $188 million from Bank of America Merrill Lynch for residential solar deployment. At first glance, that amount of activity could worry investors that SolarCity is pursuing too many verticals in parallel without focusing efforts on the most profitable segments. This type of investor sentiment is currently relevant considering that the mainstream explanation for SunEdison’s bankruptcy is simply that the company took on too much debt while drinking water from several different fire hoses. I would argue that SolarCity is similarly extended in terms of asset classes, but they have been consistently more savvy than SunEdison in regards to monetization. Unlike SunEdison, SolarCity has maintained a focus on creative financial engineering that produces near-term cash flows to sustain the upfront capital outlays required by today’s solar finance institutions. John Hancock to the rescue? On May 4th, SolarCity completed a $227 million “cash equity” financing with John Hancock Financial for approximately 200 MW of operating solar projects. This transaction serves as the most recent example of SolarCity monetizing the underlying cash flows associated with the company’s long-term power purchase agreements with individual off-takers. Unlike the two transactions in April, John Hancock’s injection is not a critical component of the capital stack to initially finance the development and construction of solar projects. This cash equity transaction is regarding solar assets already in operation, across three segments (residential, commercial, industrial), and spread between 18 U.S. states. Within this portfolio, the average FICO score for residential customers is 744, and most of the commercial off-takers are national retailers. News flash: large institutional investor is attracted to diversified portfolio with virtually no risks. Which begs the question, why did SolarCity take a discount on future cash flows and sell now? Just like every other solar company in the 3rd party ownership space, SolarCity is bleeding cash due to the high customer acquisition costs and needs to display short-term revenue to keep shareholders confident in the company’s long-term value proposition as a distributed power provider. See here for a current perspective of the 3rd party ownership climate in the U.S. Despite the success of matching low-risk solar PPA payments with an institution that is all too familiar with generic annuities, SolarCity now has some longer term expense considerations to overcome. They are still responsible for the O&M expenses related to servicing the 200 MW of assets, and they’re responsible for expenses related to decommissioning the PV systems if the PPA term is not extended. As part of the cash equity transaction, SolarCity retains the rights to 99% of the post-PPA cash flows, but it's anyone’s guess how likely it is that post-PPA revenue streams will be realized. Although this transaction structure is new and newsworthy, it’s just another tool in the solar finance industry’s toolbox to monetize future cash flows. SolarCity Cash Flows 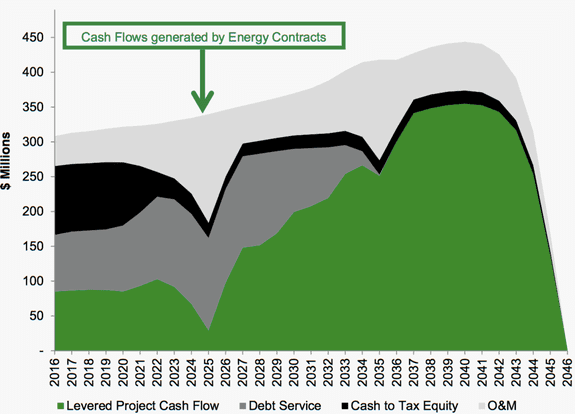 (Source: SolarCity)
The jury is still out on whether solar and securitization are a match made in heaven Asset-backed securities have a negative connotation to the layperson, to say the least. But there’s no denying that securitization can play an important role in increasing investor access to specific asset classes, as well as raising affordable sources of financing in capital intensive industries, like solar energy. The key word here is affordable. SolarCity has now sold six tranches of solar-backed securities over the last 30 months, including $49 million on March 1st when the weighted interest rate was almost two percentage points higher than a sale just 12 months earlier. The rise in SolarCity’s cost of capital is troublesome and may cause the company to abandon the new strategy and seek out alternative forms of financing. It’s clear that the 'SunEdison effect’ is having a real impact on investor comfort with the reliability of long-term solar contracts, despite the incredibly low default rates experienced by SolarCity (and others) to date. As long as default rates remain very low and companies continue to drive down the cost of customer acquisition, the opportunity to sell the underlying cash flows of solar projects will remain for both public and private developers. 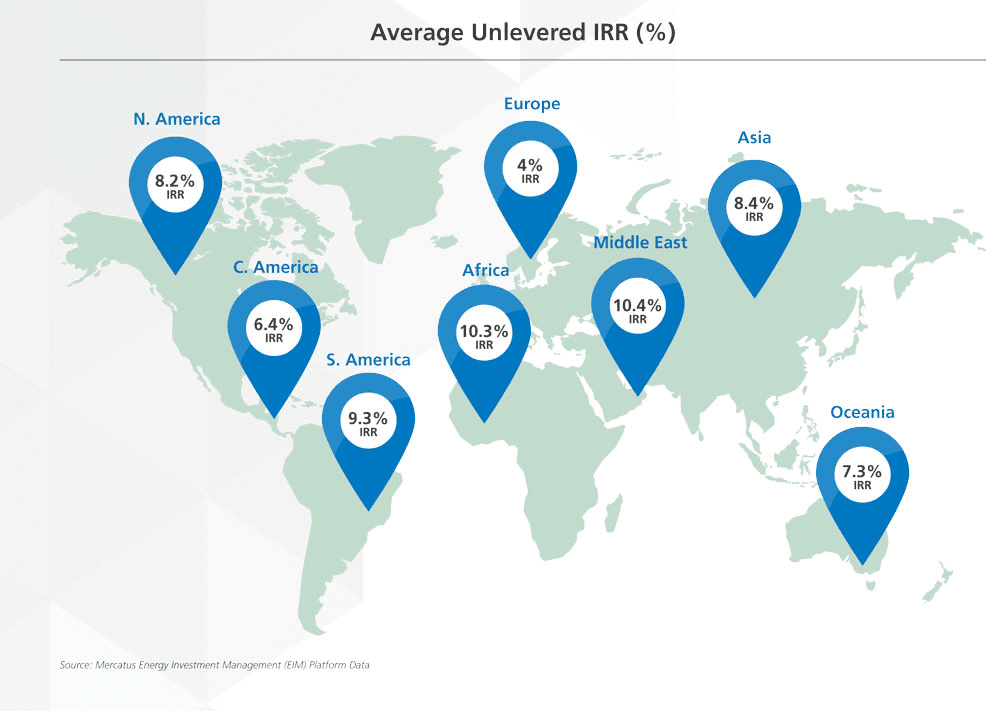 (Source: GreenTech Media)
Everyone likes lists. Lists are candy for our mind. Give me a Top 10…, and my mind naturally embraces the elegant hierarchy, 1 better than 2, and way better than 10. A simple rubric for a messy world. So, it was with some curiosity that I digested Ernst & Young’s Renewable Energy Country Attractiveness Index. See renewable energy is complex, and lists are simple, so this makes a good pairing. Like red wine (complex, hence - see, swirl, smell, sip, savor) and chocolate (simply delicious). What do we find? Clearly, United States #1! As if… The BICS - Brazil, India, China, South Africa (sorry Russia) - are all in the Top 11 and are the big upward movers. Just fascinating considering the sheer scale and dynamism of those economies. Latin America is on the rise with Chile, Argentina, and Mexico all in the Top 20 (and Summer Olympics in Rio!). And Europe is increasingly looking like a basket case. Germany, France, United Kingdom, Netherlands, and Belgium all dropped spots. Regrettably, some petulant factions within the EU are backpedaling on much of the industry-paving progress of the previous decades. What a mess. Sophisticated European investors will likely migrate into international renewable markets. After all, a 4% unlevered IRR is not going to winning any beauty contests. The ascendant BICS and Latin American countries are the investor darlings of the moment. But the renewables investment landscape is not as simple as that. For this, we another list! The Venture Capital & Private Equity Country Attractiveness Indexmeasures the...well, it basically says it in the title. Rest assured, United States #1! As if… But some mind-tickling asymmetries arise between these two lists. Ahhh -- when lists tell contradictory stories, it makes us to have think! Some countries have an attractive investment environment for renewable energy but an overall weak (or altogether suspect) environment for VC/PE investors. Take, for instance, Argentina. 18th for renewable energy investing, but a lowly 64th for VC/PE investing. Lest we forget - the economic scene in Argentina can get a little wobbly at times. A similar pattern holds for South Africa, Brazil, Morocco, Egypt, and others. All great places for renewables, but a little shaky for investment in general. So, I leave you with the holy grail concept of risk-adjusted returns. How might you adjust returns to account for risk? Well, that is more of an art than a science. No simple list can tell that story. 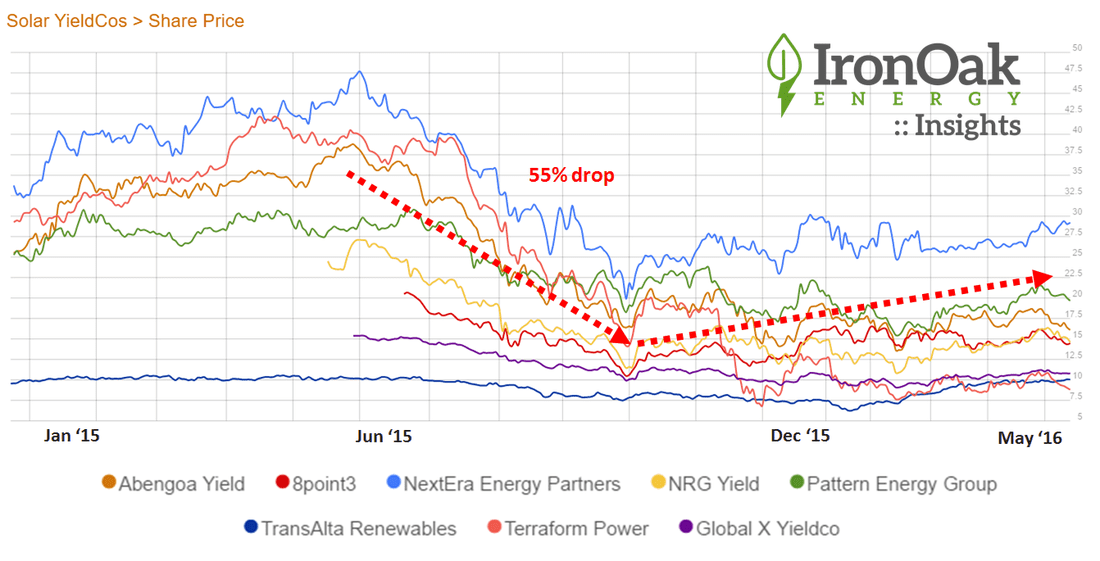 Last year, IronOak Energy’s investment advisory practice had some challenges competing against yieldcos on behalf of our solar investor partners.
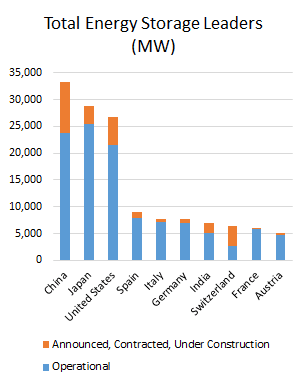
We kept abreast of the yieldco’s up/down trends at IronOak’s stock chart. They were offering what some called “a stupid low” cost of capital. That was sometimes said as a judgment on the the yieldco business model. Other times it was a said with a slight jealousy: “I wish our yields were still attractive at those levels so we could win more deals with predictable long-term cash flows.” Developers licked their lips. Those low-yield requirements made their discounted cash flow models really sing. As we all know, in late summer last year, both developers and yieldcos bought their share of Kleenex boxes. But this was great news for private equity and helped improve their returns. Many claimed the model was broken. We thought that was shortsighted. Sometimes innovators hit a speedbump, but then they hit the accelerator again. Now several yieldcos are getting ready to go to public markets. It’s not time for them to be big-time project buyers at attractive costs, but that time will come. For now, private equity still rules. Everybody loves solar. Well, except for those who think solar panels cause cancer and prevent plant photosynthesis. (Seriously. Summary here.) But we digress… Solar projects makes for great headlines, company brochures, and dinner party conversation. But are these good infrastructure investments? (Let’s keep investments in companies separate for now. Venture capital and public equities are very, very different beasts.) If you ask Warren Buffett, he has already answered, with more than $15B invested in solar (and wind) projects. I hear that he’s a pretty good investor, so that says something. And if you look at the two graphs below, then you should agree that the market is trending up. 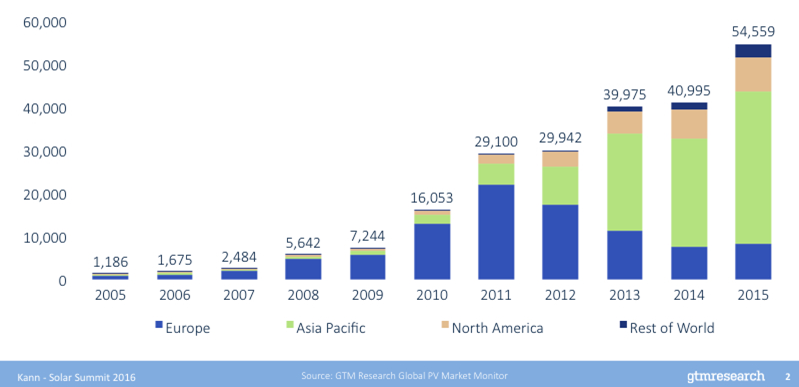 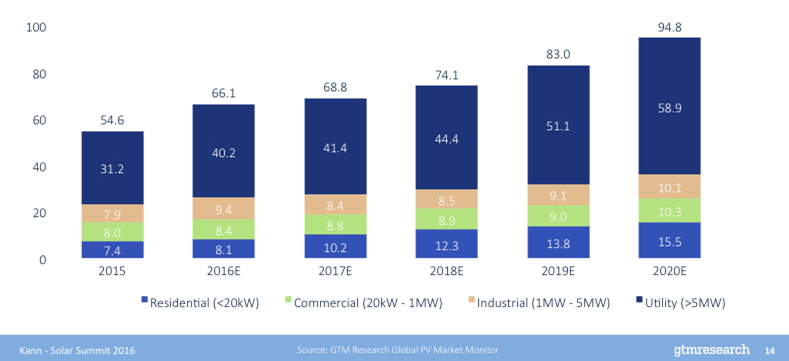 Predictable markets, especially at the utility scale, with 5-year projected growth of 1.9x versus 2015. Residential solar also looks strong at 2.1x growth over the same period. However, commercial and industrial markets may only increase about 1.3x, with one-off credit risks that challenge scaling. So, go long on U.S. solar, right? Broadly, yes, but the devil is in the details. Picking the right market, site, developer, offtaker, and finance model will, of course, make or break the deal. And these are just U.S.-specific projections. The world is a big place. Now let’s look at other countries’ experience. Summary: It’s not predictable year-over-year growth for many years. The graph below tells a different story: Solar project investments are better defined as taking a ride screaming with joy and pain on the “solar coaster.” 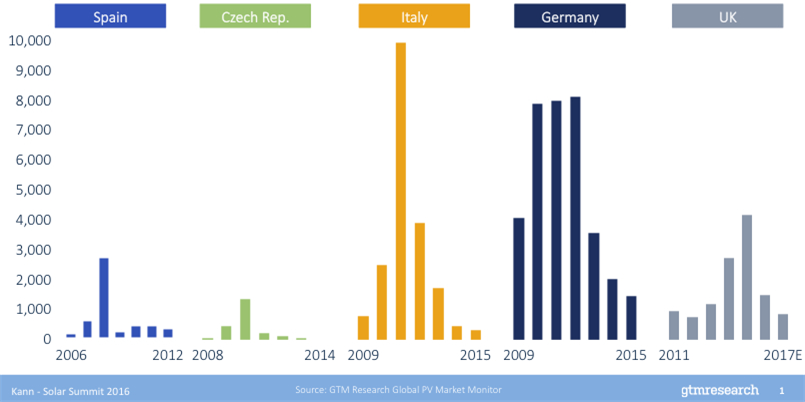 So, short solar markets in certain countries? Well, maybe, though not technically easy to do since this is mostly private, not public, equity. In summary, should you go long or short on solar infrastructure? Um...yes, let’s grab a beer and talk in more detail. In a previous blog, we reviewed how pumped hydro storage still dominates all storage technologies in the United States, with the existing capacity of 20,356 MW expected to grow by 20% with an additional 4,150 MW. Thermal storage is projected to add 302 MW of rated power to an existing 553 MW (an increase of 54%), electro-chemical approaches will add 602 MW to the existing 405 MW (+148%), and electro-mechanical technologies will add 706 MW to the existing 169 MW (+418%). How does the global picture look? We refer again to results obtained from U.S. DOE’s Energy Storage Database. The figures below show the somewhat dramatic transition between the “old” (existing operating capacity) and the “new” (projects that have been announced, contracted, or are under construction) in energy storage projects around the world. Old school made new: A pumped hydro renaissance? Pumped hydropower looks at the new-fangled batteries and other technologies coming out with regularity, and feels like a person out of place at a hipster bar. But this technology, which has been around since it was first used in Italy and Switzerland in the 1890s (soon after the world’s first hydroelectric dam began operations in Wisconsin in 1882), remains the overwhelming leader in the energy storage arena, both in existing and future capacity. Indeed, with newer variable speed pumps that are better able to coordinate with electric grid needs, a pumped hydro storage renaissance may be under way. 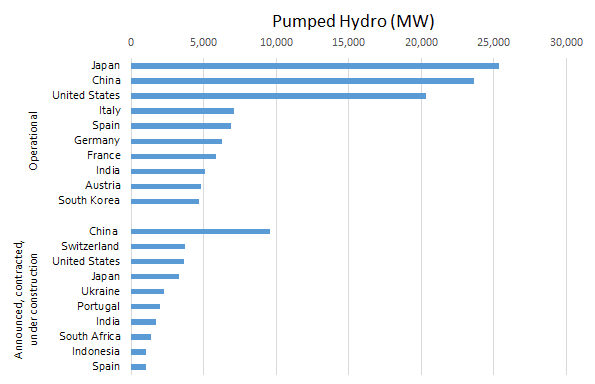 (Source: DOE Energy Storage Database, data downloaded 4/29/16) From the figure above, Japan, China, and the United States are the clear top three in this area, and each are making significant new builds along Switzerland. The scale of pumped hydro is impressive, as new projects in less developed countries such as Ukraine and India represent a higher capacity addition than those from all other technology types and all other countries. All in on the newer energy storage technologiesThe electro-chemical category includes all of types of batteries (e.g., flow, lead acid, lithium ion, metal air, sodium-based, and zinc air) as well as electro-chemical capacitors. From the chart, the United States is the clear leader in this technology type, and its capacity is expected to more than double. Other nations that have already bought into battery storage are projected to buy in even more, such as Japan, China, and Chile, with relative newcomers like Italy, The Philippines, and Kazakhstan jumping in strongly for the first time. 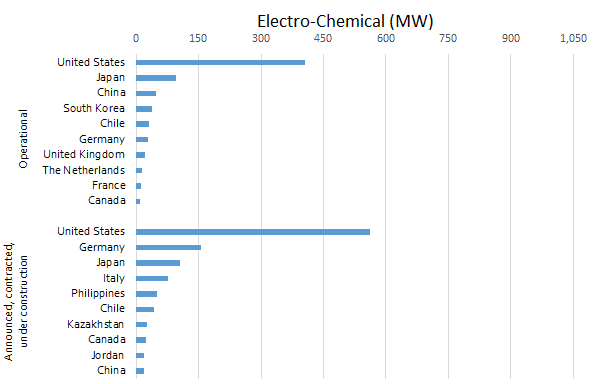 (Source: DOE Energy Storage Database, data downloaded 4/29/16) Current electro-mechanical storage applications, which include compressed air storage, flywheels, and gravitational systems such as railcars, have been tried at scale only in Germany, the United Kingdom, and the United States. And while these three top the areas with new capacity coming on, a larger set of new countries are testing the waters, though admittedly at a very small scale. 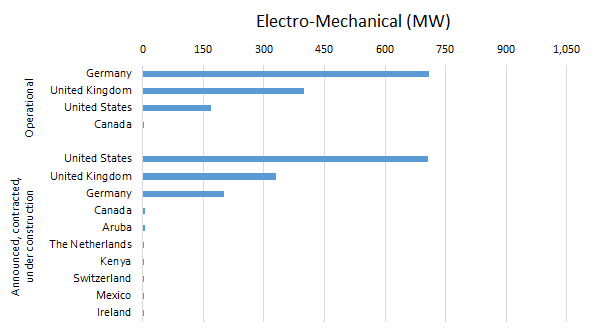 (Source: DOE Energy Storage Database, data downloaded 4/29/16) Thermal storage (e.g., ice, molten salt, and other approaches) has also been dominated by three countries—here, Spain, the United States, and South Africa. Here too the technology is diffusing across a much wider array of countries, with most outside of the original top three starting basically from scratch. 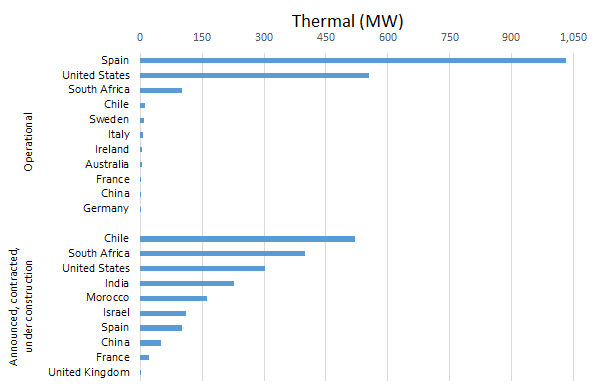 (Source: DOE Energy Storage Database, data downloaded 4/29/16) Finally, by way of comparison to the other energy storage approaches, global hydrogen storage is miniscule, as the total of listed projects includes 2.7 MW in Germany and 0.2 MW in France. The method is straightforward—excess electricity is sent through a Proton Exchange Membrane (PEM) to electrolyse water into hydrogen and oxygen. The hydrogen can be stored on-site (as with a “wind to hydrogen” concept for wind turbines) and then later either sold and fed either into pipelines for grid electricity production or used directly for on-site electricity generation in a fuel cell. (It can also be sold for use in fuel cell vehicles, or as an input in ammonia production). Although the base is low, this method of storing energy is expected to more than double in global size, with Canada, Italy, and Germany developing an additional 2, 1.2, and 0.8 MW, respectively. Many future energy storage leaders are starting from scratchIn the final two graphs below, we see the total rated power of energy storage by the leading countries, including both existing capacity (in blue) and capacity expected to come on line soon (orange). As noted before, pumped hydro skews the results. At left, which includes pumped hydro, China, Japan, and the United States will remain the dominant players in energy storage overall, with significant capacity additions expected for these countries as well as Switzerland, which will more than double its storage capacity. Other nations in Europe—like Spain, Italy, Germany, France, and Austria—will be relatively stable when it comes to total energy storage.
(Source: DOE Energy Storage Database, data downloaded 4/29/16)
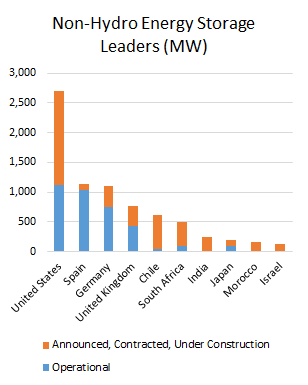
At right, taking out the pumped hydro data, notice first that the y-axis scale has dropped by an order of magnitude! In this non-hydro arena, the United States is the clear global leader. Also notable is that many countries are almost starting from scratch to build energy storage capacity in these non-hydro technologies, including Chile, South Africa, India, Morocco, and Israel, while Germany, the United Kingdom, and Japan will be making significant additions. The lessons? If you’re in the battery or other non-pumped hydro storage areas, be aware that efficiencies are improving in pumped hydro that may be worth paying attention to, at least at the international level. And of course if you’re in the pumped hydro field, you have some new competitors as well. Further reading: |
sign up for ironoak's NewsletterSent about twice per month, these 3-minute digests include bullets on:
Renewable energy | Cleantech & mobility | Finance & entrepreneurship | Attempts at humor (what?) author
Photo by Patrick Fore on Unsplash
|

© 2009-2022 IronOak Energy Capital, LLC | (888) 249-3013