
|
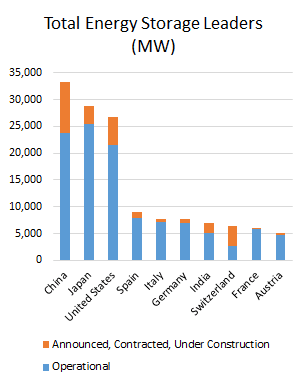
In a previous blog, we reviewed how pumped hydro storage still dominates all storage technologies in the United States, with the existing capacity of 20,356 MW expected to grow by 20% with an additional 4,150 MW. Thermal storage is projected to add 302 MW of rated power to an existing 553 MW (an increase of 54%), electro-chemical approaches will add 602 MW to the existing 405 MW (+148%), and electro-mechanical technologies will add 706 MW to the existing 169 MW (+418%). How does the global picture look? We refer again to results obtained from U.S. DOE’s Energy Storage Database. The figures below show the somewhat dramatic transition between the “old” (existing operating capacity) and the “new” (projects that have been announced, contracted, or are under construction) in energy storage projects around the world. Old school made new: A pumped hydro renaissance? Pumped hydropower looks at the new-fangled batteries and other technologies coming out with regularity, and feels like a person out of place at a hipster bar. But this technology, which has been around since it was first used in Italy and Switzerland in the 1890s (soon after the world’s first hydroelectric dam began operations in Wisconsin in 1882), remains the overwhelming leader in the energy storage arena, both in existing and future capacity. Indeed, with newer variable speed pumps that are better able to coordinate with electric grid needs, a pumped hydro storage renaissance may be under way. 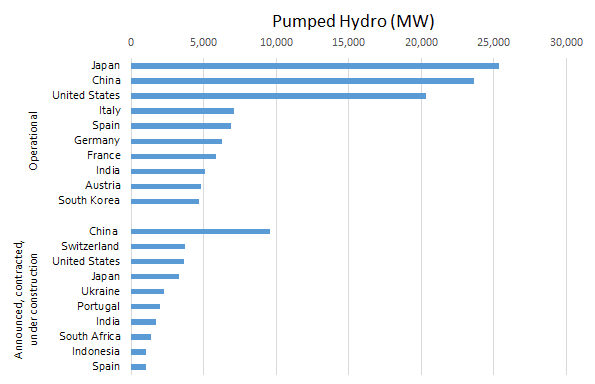 (Source: DOE Energy Storage Database, data downloaded 4/29/16) From the figure above, Japan, China, and the United States are the clear top three in this area, and each are making significant new builds along Switzerland. The scale of pumped hydro is impressive, as new projects in less developed countries such as Ukraine and India represent a higher capacity addition than those from all other technology types and all other countries. All in on the newer energy storage technologiesThe electro-chemical category includes all of types of batteries (e.g., flow, lead acid, lithium ion, metal air, sodium-based, and zinc air) as well as electro-chemical capacitors. From the chart, the United States is the clear leader in this technology type, and its capacity is expected to more than double. Other nations that have already bought into battery storage are projected to buy in even more, such as Japan, China, and Chile, with relative newcomers like Italy, The Philippines, and Kazakhstan jumping in strongly for the first time. 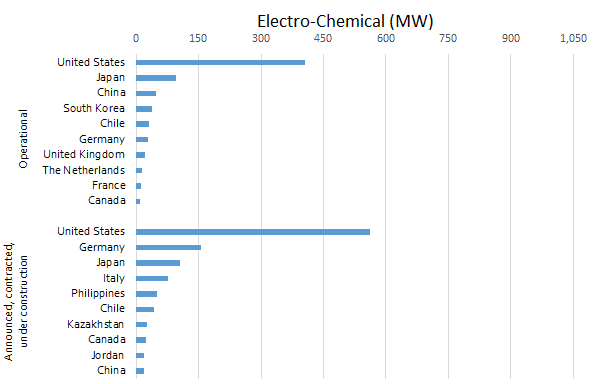 (Source: DOE Energy Storage Database, data downloaded 4/29/16) Current electro-mechanical storage applications, which include compressed air storage, flywheels, and gravitational systems such as railcars, have been tried at scale only in Germany, the United Kingdom, and the United States. And while these three top the areas with new capacity coming on, a larger set of new countries are testing the waters, though admittedly at a very small scale. 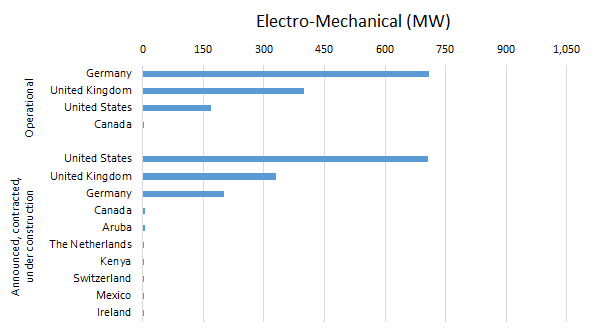 (Source: DOE Energy Storage Database, data downloaded 4/29/16) Thermal storage (e.g., ice, molten salt, and other approaches) has also been dominated by three countries—here, Spain, the United States, and South Africa. Here too the technology is diffusing across a much wider array of countries, with most outside of the original top three starting basically from scratch. 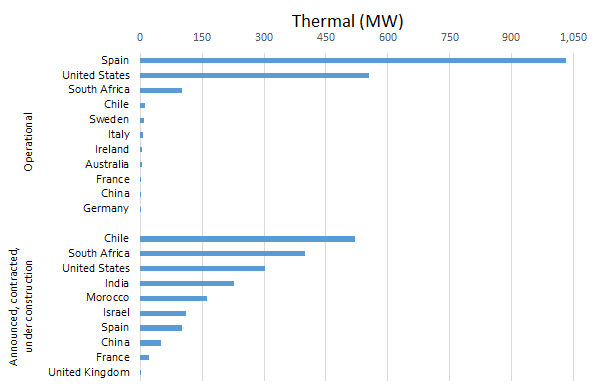 (Source: DOE Energy Storage Database, data downloaded 4/29/16) Finally, by way of comparison to the other energy storage approaches, global hydrogen storage is miniscule, as the total of listed projects includes 2.7 MW in Germany and 0.2 MW in France. The method is straightforward—excess electricity is sent through a Proton Exchange Membrane (PEM) to electrolyse water into hydrogen and oxygen. The hydrogen can be stored on-site (as with a “wind to hydrogen” concept for wind turbines) and then later either sold and fed either into pipelines for grid electricity production or used directly for on-site electricity generation in a fuel cell. (It can also be sold for use in fuel cell vehicles, or as an input in ammonia production). Although the base is low, this method of storing energy is expected to more than double in global size, with Canada, Italy, and Germany developing an additional 2, 1.2, and 0.8 MW, respectively. Many future energy storage leaders are starting from scratchIn the final two graphs below, we see the total rated power of energy storage by the leading countries, including both existing capacity (in blue) and capacity expected to come on line soon (orange). As noted before, pumped hydro skews the results. At left, which includes pumped hydro, China, Japan, and the United States will remain the dominant players in energy storage overall, with significant capacity additions expected for these countries as well as Switzerland, which will more than double its storage capacity. Other nations in Europe—like Spain, Italy, Germany, France, and Austria—will be relatively stable when it comes to total energy storage.
(Source: DOE Energy Storage Database, data downloaded 4/29/16)
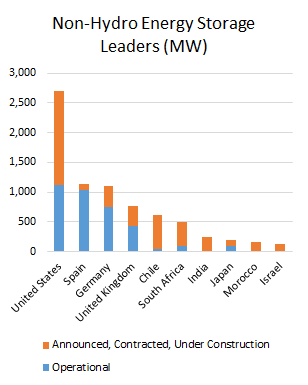
At right, taking out the pumped hydro data, notice first that the y-axis scale has dropped by an order of magnitude! In this non-hydro arena, the United States is the clear global leader. Also notable is that many countries are almost starting from scratch to build energy storage capacity in these non-hydro technologies, including Chile, South Africa, India, Morocco, and Israel, while Germany, the United Kingdom, and Japan will be making significant additions. The lessons? If you’re in the battery or other non-pumped hydro storage areas, be aware that efficiencies are improving in pumped hydro that may be worth paying attention to, at least at the international level. And of course if you’re in the pumped hydro field, you have some new competitors as well. Further reading: Comments are closed.
|
sign up for ironoak's NewsletterSent about twice per month, these 3-minute digests include bullets on:
Renewable energy | Cleantech & mobility | Finance & entrepreneurship | Attempts at humor (what?) author
Photo by Patrick Fore on Unsplash
|

© 2009-2022 IronOak Energy Capital, LLC | (888) 249-3013