
|
Global Megawatt-Scale PV O&M and Asset Management Competitive Landscape 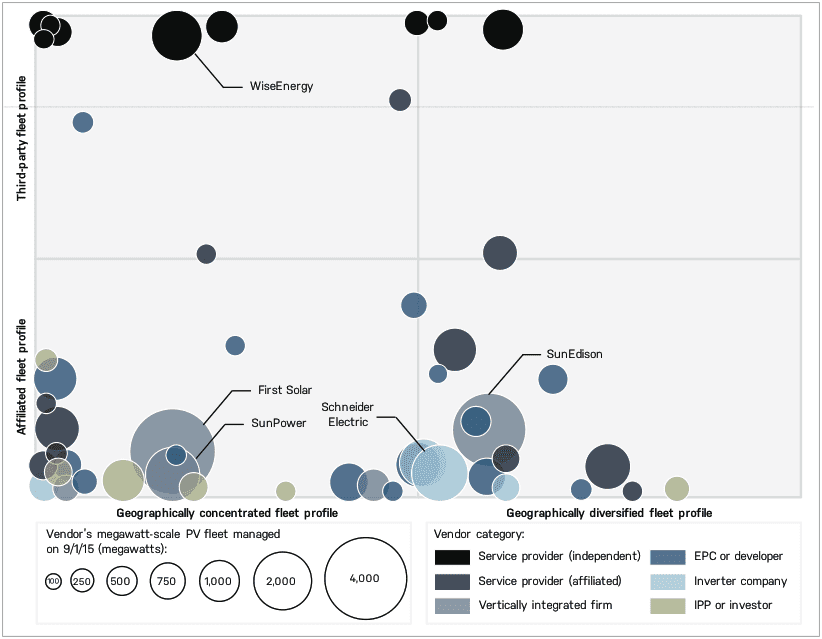 (Source: Greentech Media)
Related data points:
U.S. solar investment and deployment will continue the charge forward, but not everywhere Clean energy investment reached a record $329B globally in 2015, $56B of which took place in the U.S. The international and national policy winds are all pushing in favor of further accelerating clean energy investment in the coming years. However, there is more complexity at the level of local politics with entrenched utilities and PUCs. Do not underestimate the ripple effect of the conflict on solar policy in Nevada. A class action lawsuit was recently filed in protest of the draconian sanctions imposed on the solar industry and homeowners who had invested in solar systems under a now defunct incentive structure. Add the Nevada dispute to the growing list of local conflicts in Arizona, Hawaii, Colorado, and Minnesota, and a clearer picture of just how embattled the solar industry has become in many places around the country becomes clear. It is curious that so many conflicts are emerging despite the fact that the vast majority of Americans support solar across the political spectrum. An excellent analysis of these “niche-regime” conflicts was recently published by Dr. David J. Hess of Vanderbilt University, which concluded that we can expect continued resistance from incumbent (“regime”) utilities and PUCs that perceive the solar industry (“niche”) to be a threat to their way of doing business, especially in geographies where the solar industry is associated with a political party that is not well represented in local governing bodies. As a result, we may start seeing a more fragmented landscape of solar investment and deployment activity in accordance with the level of local policy support or resistance. Solar investors and developers, who tend to be very sensitive to the policy drivers that underpin their business strategies, will need to remain ever-vigilant of local and state policy, even in the context of the extended solar ITC. That being said, agile solar developers that can quickly adapt to the shifting solar policy landscape, especially in emerging markets, will have a leg up on the competition. Solar development will experience a downtick in 2016, but it will be good in the long-run According to SEIA, the ITC extension will lead to more than 72 GW of solar PV installations from 2016 through 2020, an increase of over 25 GW (or 54%) over baseline expectations without the extension. However, with the pull effect of the solar ITC cliff at the end of 2016 diminished, there may be less solar installation in 2016 than was previously projected. In fact, growth in the solar industry may slow in 2016 to an estimated 8% according to S&P in 2016, compared to the over 20% growth seen in 2015. While this may have negative ramifications for the near-term cash flows generated by some solar companies, and by extension the valuation of some publicly traded solar companies, it will be beneficial for project investors. The smoothing of solar policy support and hence development over the next 5 years will allow for more prudent investment that can generate better long-term returns. There will be more room for patient capital, and investors willing to do the research and diligence to identify good investments for their risk tolerance. The race to the end the solar industry’s dependence on the ITC has gotten moved into the 2020s, a point at which solar will hopefully no longer needs tax equity in order to make sense in most geographies around the U.S. While solar policy and finance dominate the headlines, solar technology will continue up the learning curve Since the implementation of the ITC in 2006, the cost to install solar has dropped by more than 73%. Across the U.S., the average total project cost for solar is hovering around $2.42/watt for non-residential and utility-scale installations. That is what is often meant by the technology learning curve: decreasing system costs. With all of the focus on how rapidly solar has gotten cheaper, some focus has been taken away from how much better the technology is getting. Just over the last 5 years, solar modules have experienced a massive proliferation of technologies, which are pushing the bounds of efficiency and performance. A compelling graphic of the state of solar module technology produced by NREL suggests that previously unheard efficiencies of 30% and higher are now feasible in laboratory settings, and some of these are ripe for commercialization. The crux of the matter, of course, is how cost efficient these cutting edge solar module technologies can be. If commercial solar module technologies can achieve a bump in efficiencies at a price that the market can withstand, we could see some dramatic improvements in solar project finance. The US DOE’s SunShot program is trying to accelerate the deployment of the new generation of commercial solar module technology with their recent announcement of a $22.7M investment across 23 promising projects. Even if we take the cutting edge technologies off the table, the most prevalent types of solar panels being deployed, crystalline silicon and thin-film panels, have become much more efficient in recent years. So, amid all of the hoopla about solar deployment, let’s not lose sight of the horizon for solar module technologies. Further reading:
Comments are closed.
|
sign up for ironoak's NewsletterSent about twice per month, these 3-minute digests include bullets on:
Renewable energy | Cleantech & mobility | Finance & entrepreneurship | Attempts at humor (what?) author
Photo by Patrick Fore on Unsplash
|

© 2009-2022 IronOak Energy Capital, LLC | (888) 249-3013