
|
The U.S. DOE’s Energy Storage Database is a powerful tool available to assess the current state of the global energy storage market. Built by Sandia National Laboratory, under an ongoing contract with Strategen Consulting, the database allows for searching and filtering across both storage policies and projects, in the United States and globally. Here we take a closer look at what the data can show us about the energy storage project pipeline. “Energy storage” encompasses a wide array of technologies, applications, and public policy inducementsFor policy analysis, the user is able to sort and filter according to the following criteria:
Four major energy storage technology families can be distinguished, including:
The U.S. energy storage pipeline: Pumped hydro still dominates, but its position is weakening The total rated power capacity of currently operating U.S. energy storage comes to 21,484 MW. (Over the years, 15,584 MW has been decommissioned, and 7,684 MW is currently offline or under repair). This U.S. capacity will grow by 5,760 MW in additional energy storage capacity, going by those projects that have been announced, are contracted, or are under construction. 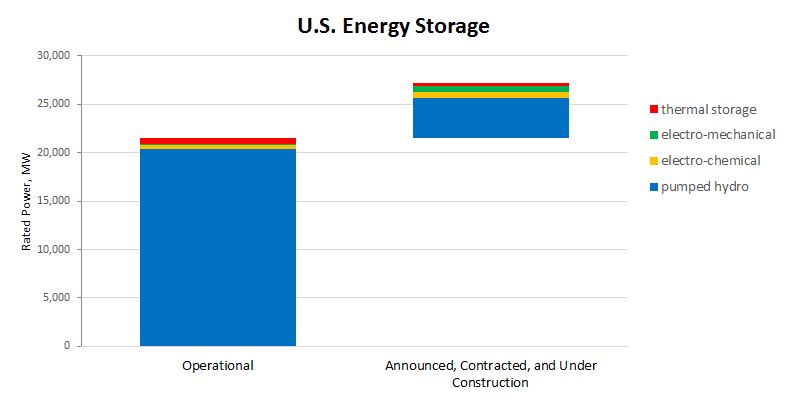 (Source: DOE Energy Storage Database, data downloaded 3/20/16) We see that pumped hydropower storage remains the giant in the field, with a pipeline of 4,150 MW of rated power to add to existing operations of 20,356 MW. However, among the technologies, it is growing the slowest, adding only 20% of capacity. Thermal storage is expected to add 302 MW of rated power to the existing 553 MW (an increase of 54%). Electro-chemical approaches will add 602 MW, a rise of 148% over the existing 405 MW of rated power capacity. The most dramatic pipeline growth, relative to existing capacity, is with the electro-mechanical technologies such as compressed air storage and flywheels, a finding that runs counter to prevailing assumptions in the market. An additional 706 MW of power capacity is expected to come on line in this area, an increase of 418% over the present capacity of 169 MW. 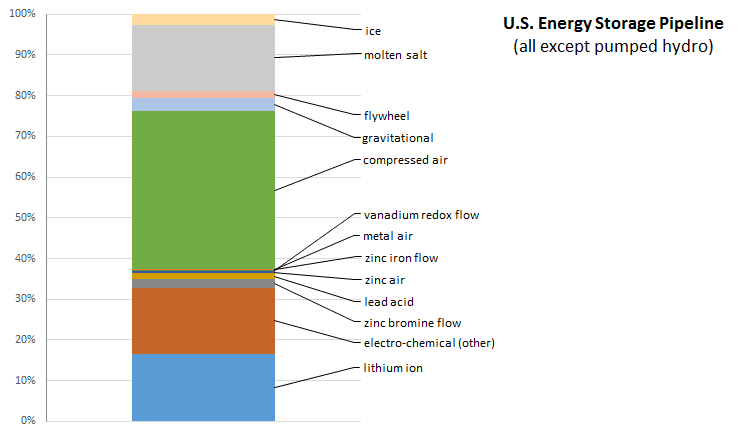 (Source: DOE Energy Storage Database, data downloaded 3/20/16) At the top of this chart we see the thermal projects that have been announced, contracted or are under construction. Next are the clusters for electro-mechanical and battery technologies. No projects are listed for sodium-based or zinc manganese dioxide batteries, or for electric capacitors. What is the takeaway message for investors? Future tendencies may not all be about batteries, and one would be wise to consider all available energy storage applications, depending on the project needs. Finally, where in the United States are most of these projects headed? According to research by CleanTechnica, California is leading the way, likely due to the recent state-level energy storage mandate. 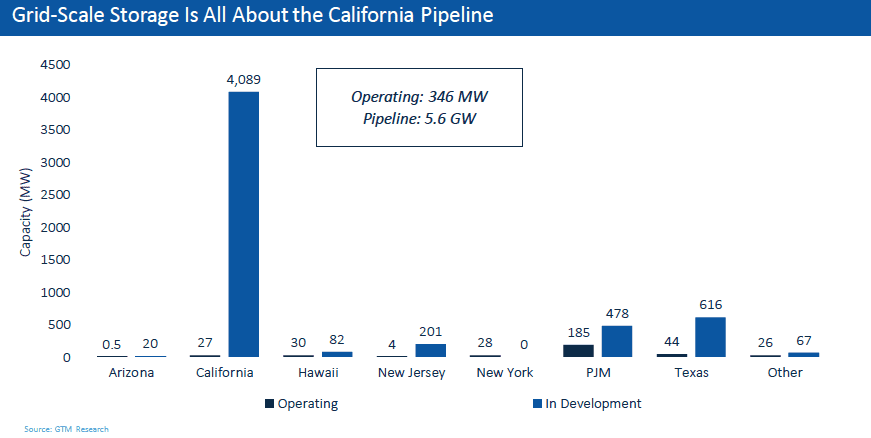 Related data points:
Comments are closed.
|
sign up for ironoak's NewsletterSent about twice per month, these 3-minute digests include bullets on:
Renewable energy | Cleantech & mobility | Finance & entrepreneurship | Attempts at humor (what?) author
Photo by Patrick Fore on Unsplash
|

© 2009-2022 IronOak Energy Capital, LLC | (888) 249-3013